


Shopping is a major upgrade to our previous AI shopping features, and this blog post goes deep. Here’s what’s new if you want the short version before diving in:
- Product performance: Track how your products appear in AI shopping results across ChatGPT, Copilot, and soon, Perplexity—how many, which ones, and where they rank. Drill down to see which products are gaining or losing ground for the prompts you care about.
- Competitive landscape: See which competitors show up alongside you in AI shopping results—and how your products compare for metrics like share of shelf and first position win rate. Dig into each product for full visibility into competitor performance across prompts.
- Retailer visibility: Find out which retailers are capturing AI visibility for your products, how often AI links out to your website versus a third party’s, and which retailers are most likely to intercept your AI-driven clicks and conversions.
- Prompt-level insights: Learn which prompts surface your products, which ones competitors are winning and you’re not, and what AI answers look like across different queries so you know where to act first.
LLMs don’t just speak in brands—they speak in SKUs.
When someone asks, “What running shoes should I buy for marathon training?” AI doesn’t say, “Nike makes good shoes.”
It says: “The Hoka Clifton 10 is super cushioned and ideal for long runs” or “The Adidas Adizero Boston 13 is great for training and speed workouts.”
Then it serves up product images, ratings, prices, and retailer links.
The question for brands: When AI recommends products, are yours on the shortlist?
Since launching shopping coverage in 2025, we've seen a significant shift in how brands understand the role of AI in the purchase process—and a surge in demand for greater depth of detail.
Not just about their own products, but also the competitor and retailer landscape.
Our new and improved Shopping experience delivers.
You can now use Scrunch to:
- Get full visibility into which of your products are winning AI shelf space, which are losing ground, and which have gone dark.
- See how you compare to competitors across every metric that matters—share of shelf, first position win rate, and beyond.
- Find out which retailers are positioned to capture AI-driven clicks and how much traffic may be bypassing your site.
- Pinpoint the prompts driving your AI shopping results and the ones working against you.
Here’s what’s new.
See how your products show up in AI search
Job to be done: Get a board-ready view of product performance across AI shopping results instead of trying to manually piece together a picture from scattered signals.
Scrunch auto-captures product recommendations in AI search results, classifies them (i.e., your brand, competitors, or third parties), and turns them into actionable intel in a dedicated dashboard segmented by products, competitors, retailers, and prompts.
Soon you'll also be able to ingest your full product feed into Scrunch and define your own product catalog for even more precise monitoring and optimization.
All data can be filtered by time frame, sub-brand, persona, platform, topic, funnel stage, country, branded vs. non-branded prompts, and custom tag.
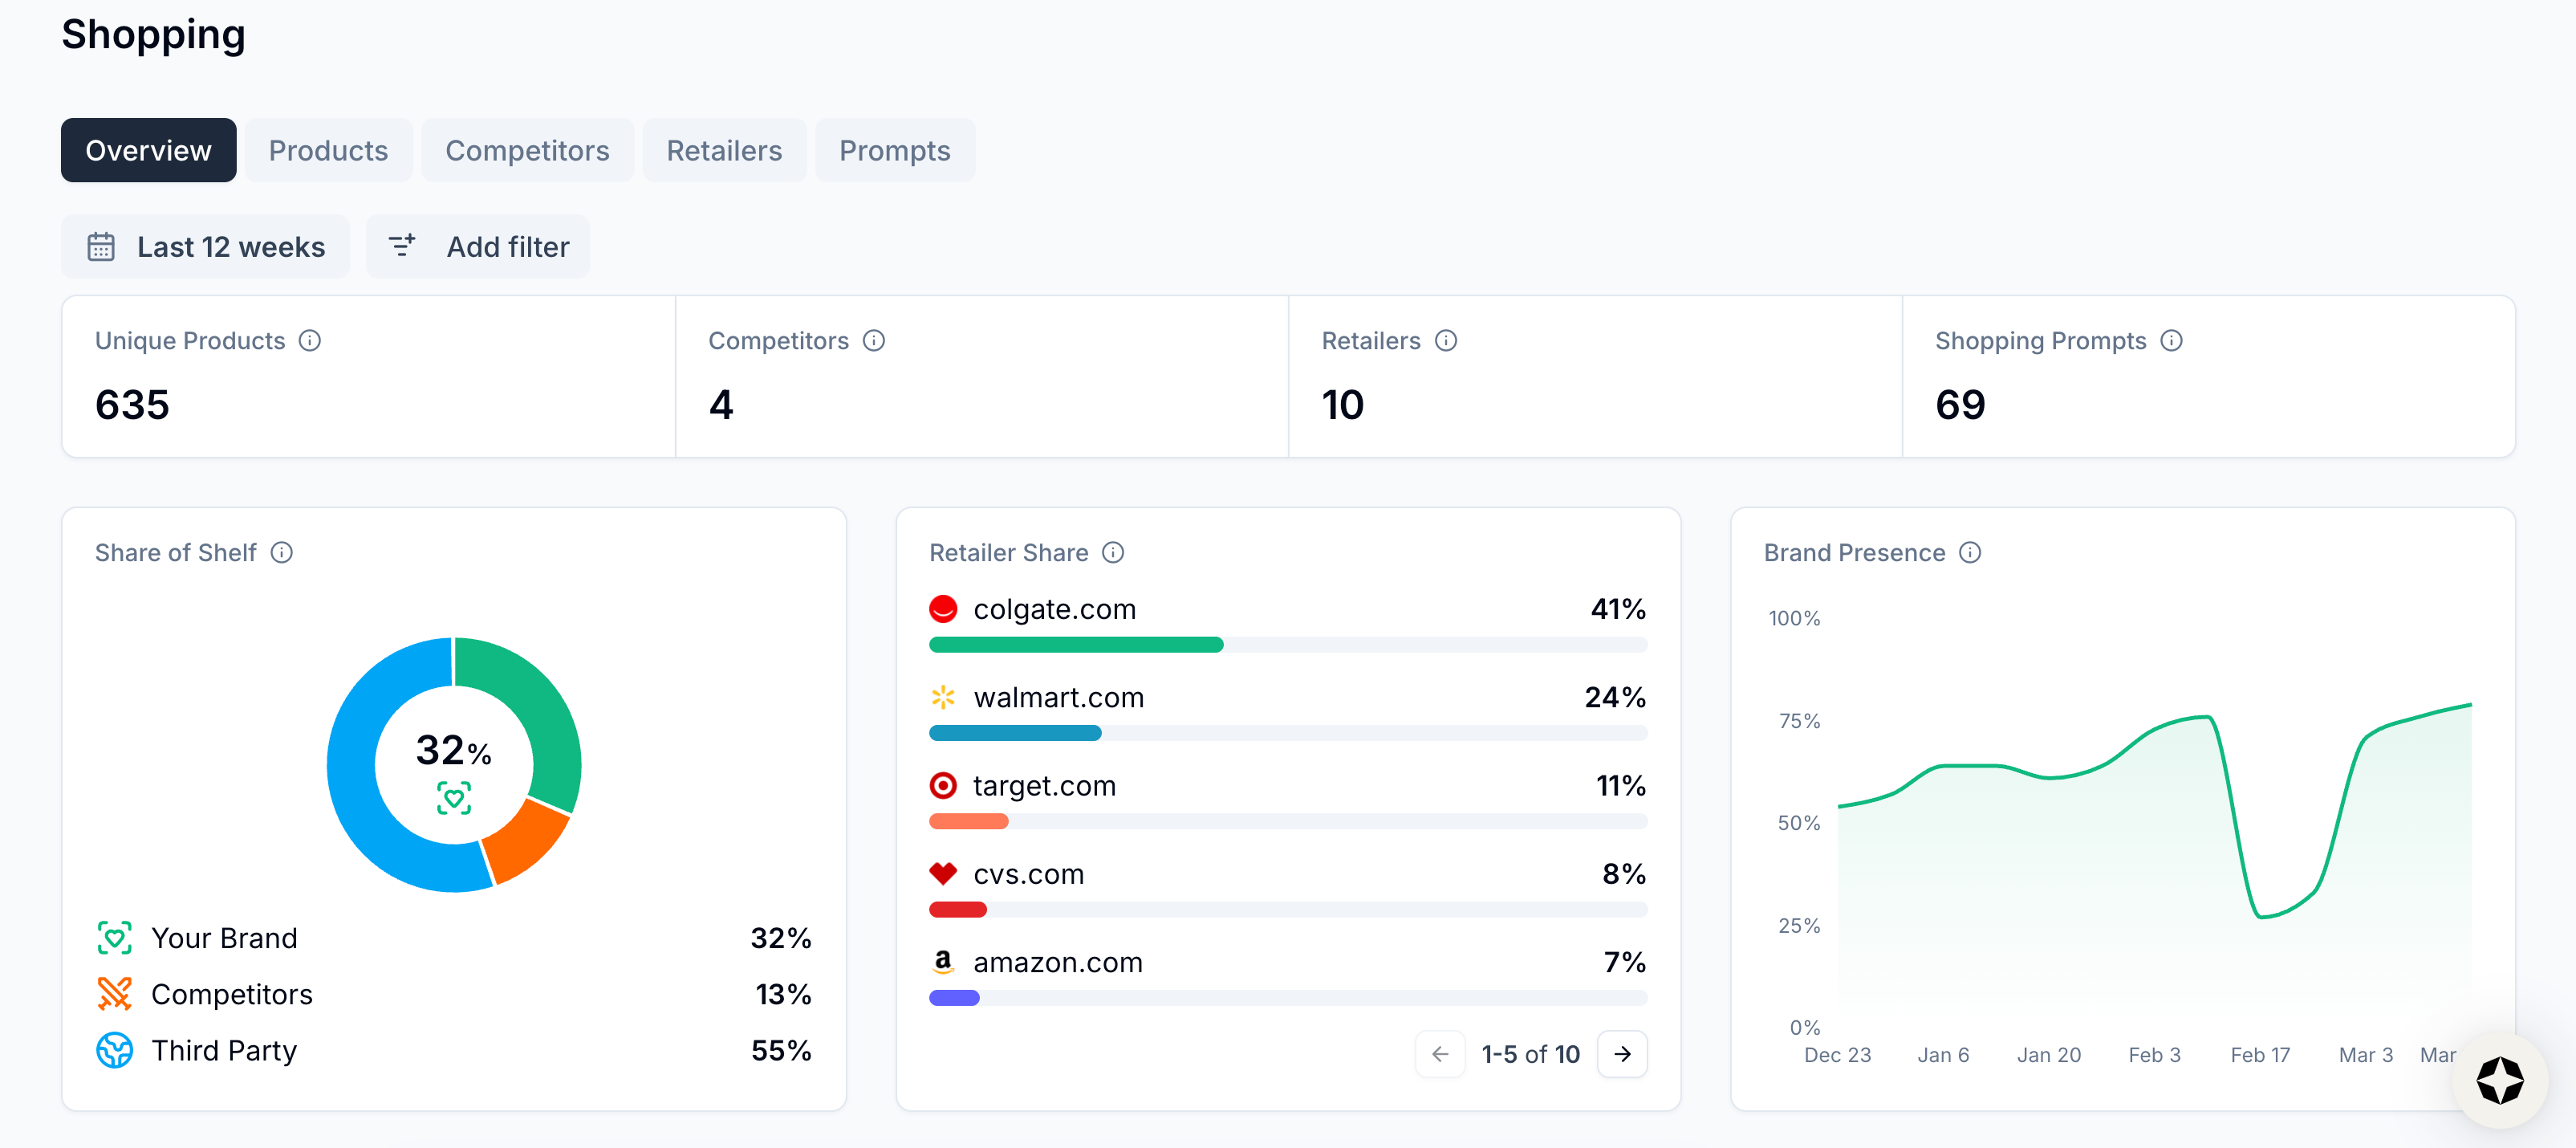
We start by giving you the lay of the land:
- Unique Products: Number of unique products identified across shopping results
- Competitors: Number of competitors appearing in shopping results across your prompts
- Retailers: Number of retailer domains carrying your products in shopping results
- Shopping Prompts: Number of tracked prompts that trigger shopping product results across AI platforms
Next we provide a high-level rundown of the competitive story, retailer mix, and your brand presence:
Share of Shelf
AI platforms recommend only a handful of products per prompt, so each slot matters. This tells you what slice of those picks belong to you versus competitors and third parties, so you know whether you're dominating the conversation or barely showing up in it.
Retailer Share
AI doesn't just recommend your products—it also picks which retailer (e.g., what website to purchase the product from) gets the click. This shows you which retailers are appearing across your shopping results so you can see where your sales are being directed and act on it.
Brand Presence
When it comes to product visibility, consistency is king. This shows you the percentage of shopping prompts where at least one of your products appears—tracked daily, weekly, or monthly, depending on your date range—so you can see whether your presence is stable.
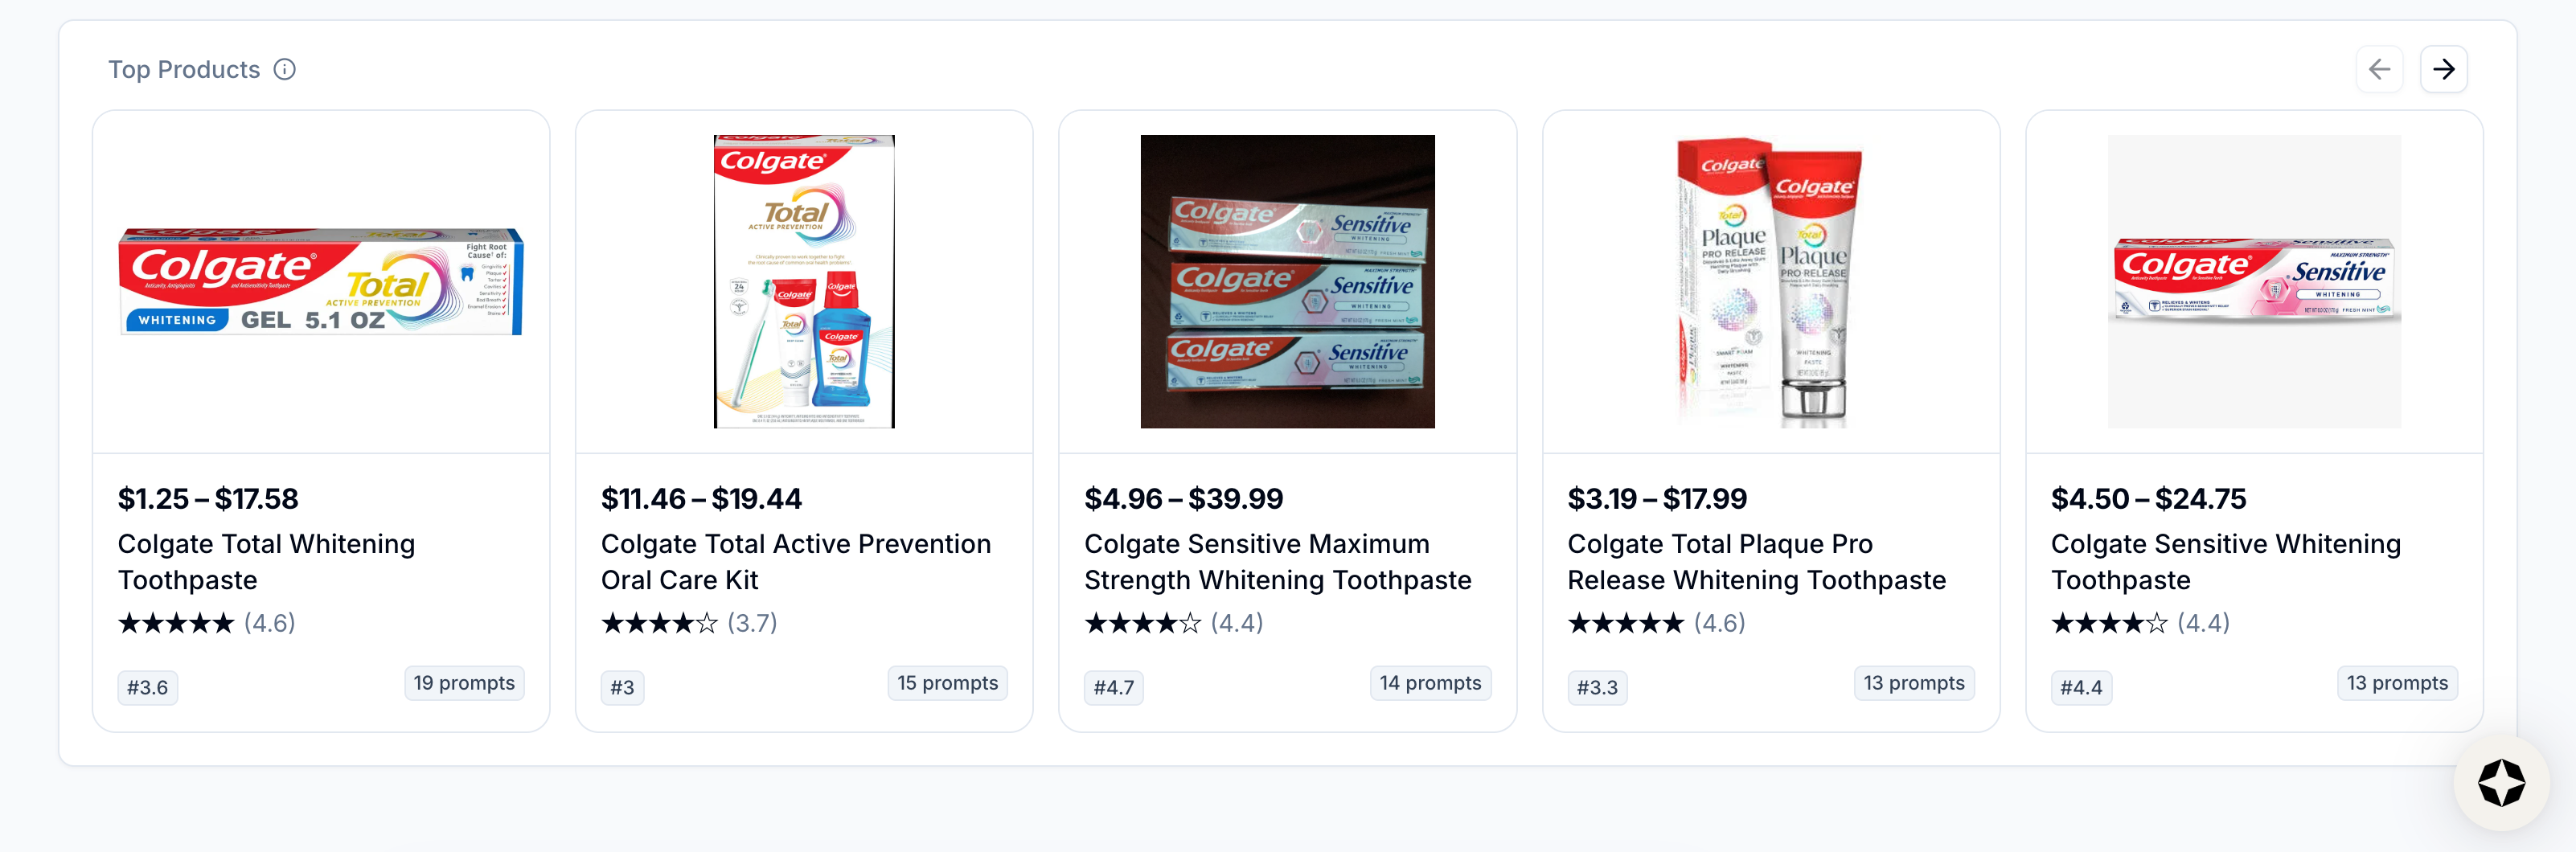
Finally, we spotlight which of your products are most frequently recommended across shopping prompts, ranked by how many prompts surface each product.
This shows you which products AI platforms are actively recommending so you know where to double down and where to investigate.
From here, you can dig into the data anyway you want—by product, competitor, retailer, or prompt.
Drill down into product performance
Job to be done: Identify which products are winning, losing, or invisible in AI search without wasted time or guesswork across different prompts, platforms, and personas.
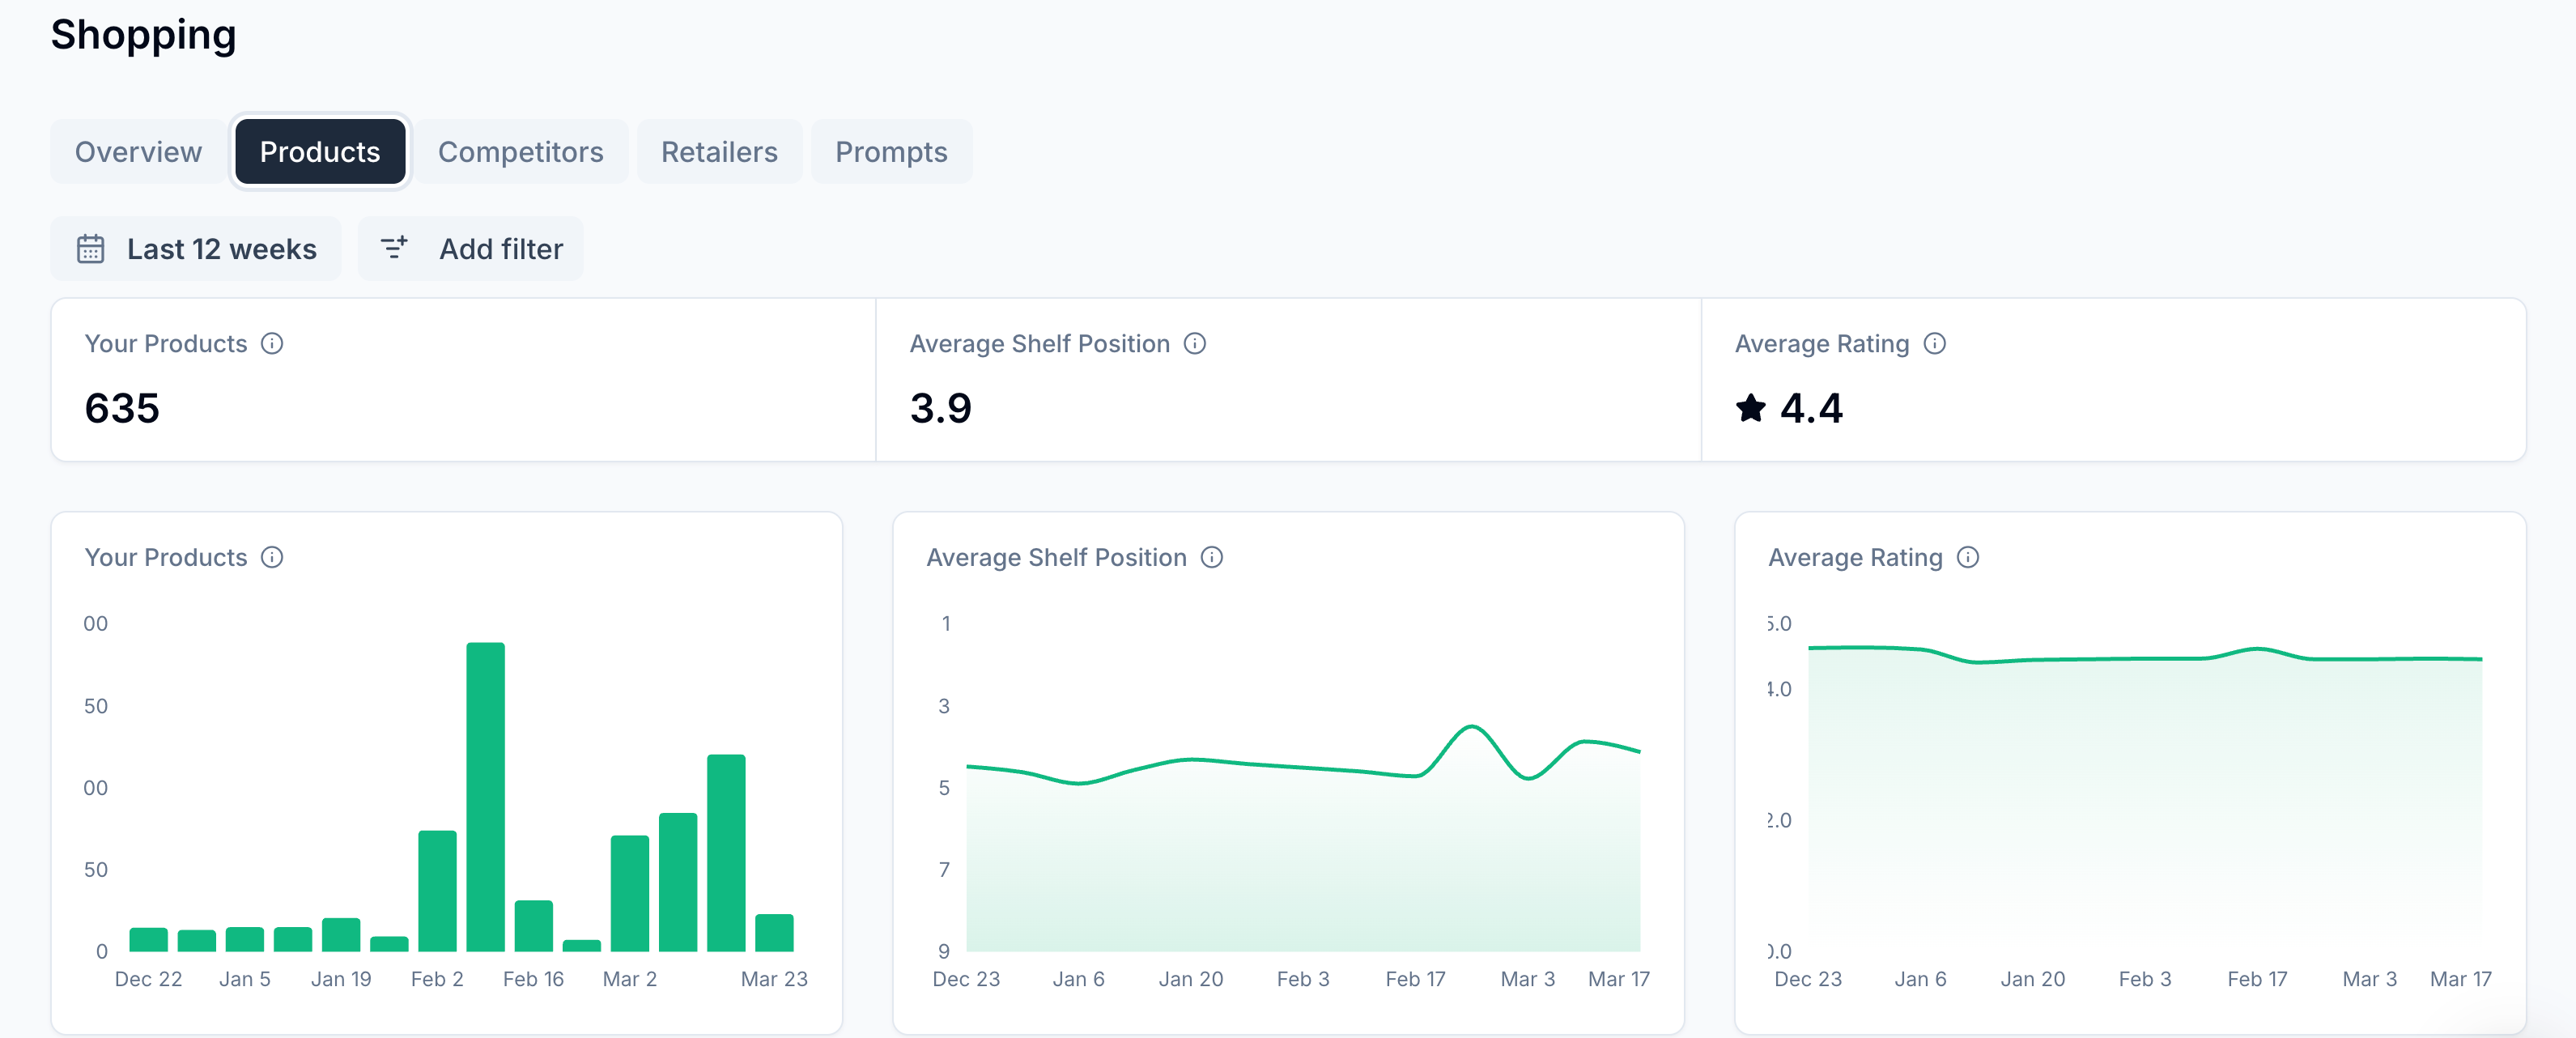
Scrunch breaks down your product performance based on:
- Your Products: How many of your brand’s products are identified across shopping results
- Average Shelf Position: In what order your products are recommended in shopping results on average (the lower the number, the higher up you’re mentioned in AI answers)
- Average Rating: How highly your products are rated in shopping results on average
All of this data is displayed in customizable graphs that reveal change over time.

Next you can drill down product by product:
Product Presence
Your products may give ground or make headway over time. This shows you which products are slipping and emerging by allowing you to filter between products that are newly appearing in AI shopping results and ones that were showing up before but have since dropped off.
Product Movement
Shelf position isn't static—it shifts with marketing campaigns, competitive launches, and AI platform updates. This shows you which products have climbed or fallen in average shelf position over your selected time period, so you know where momentum is building and where it isn't.
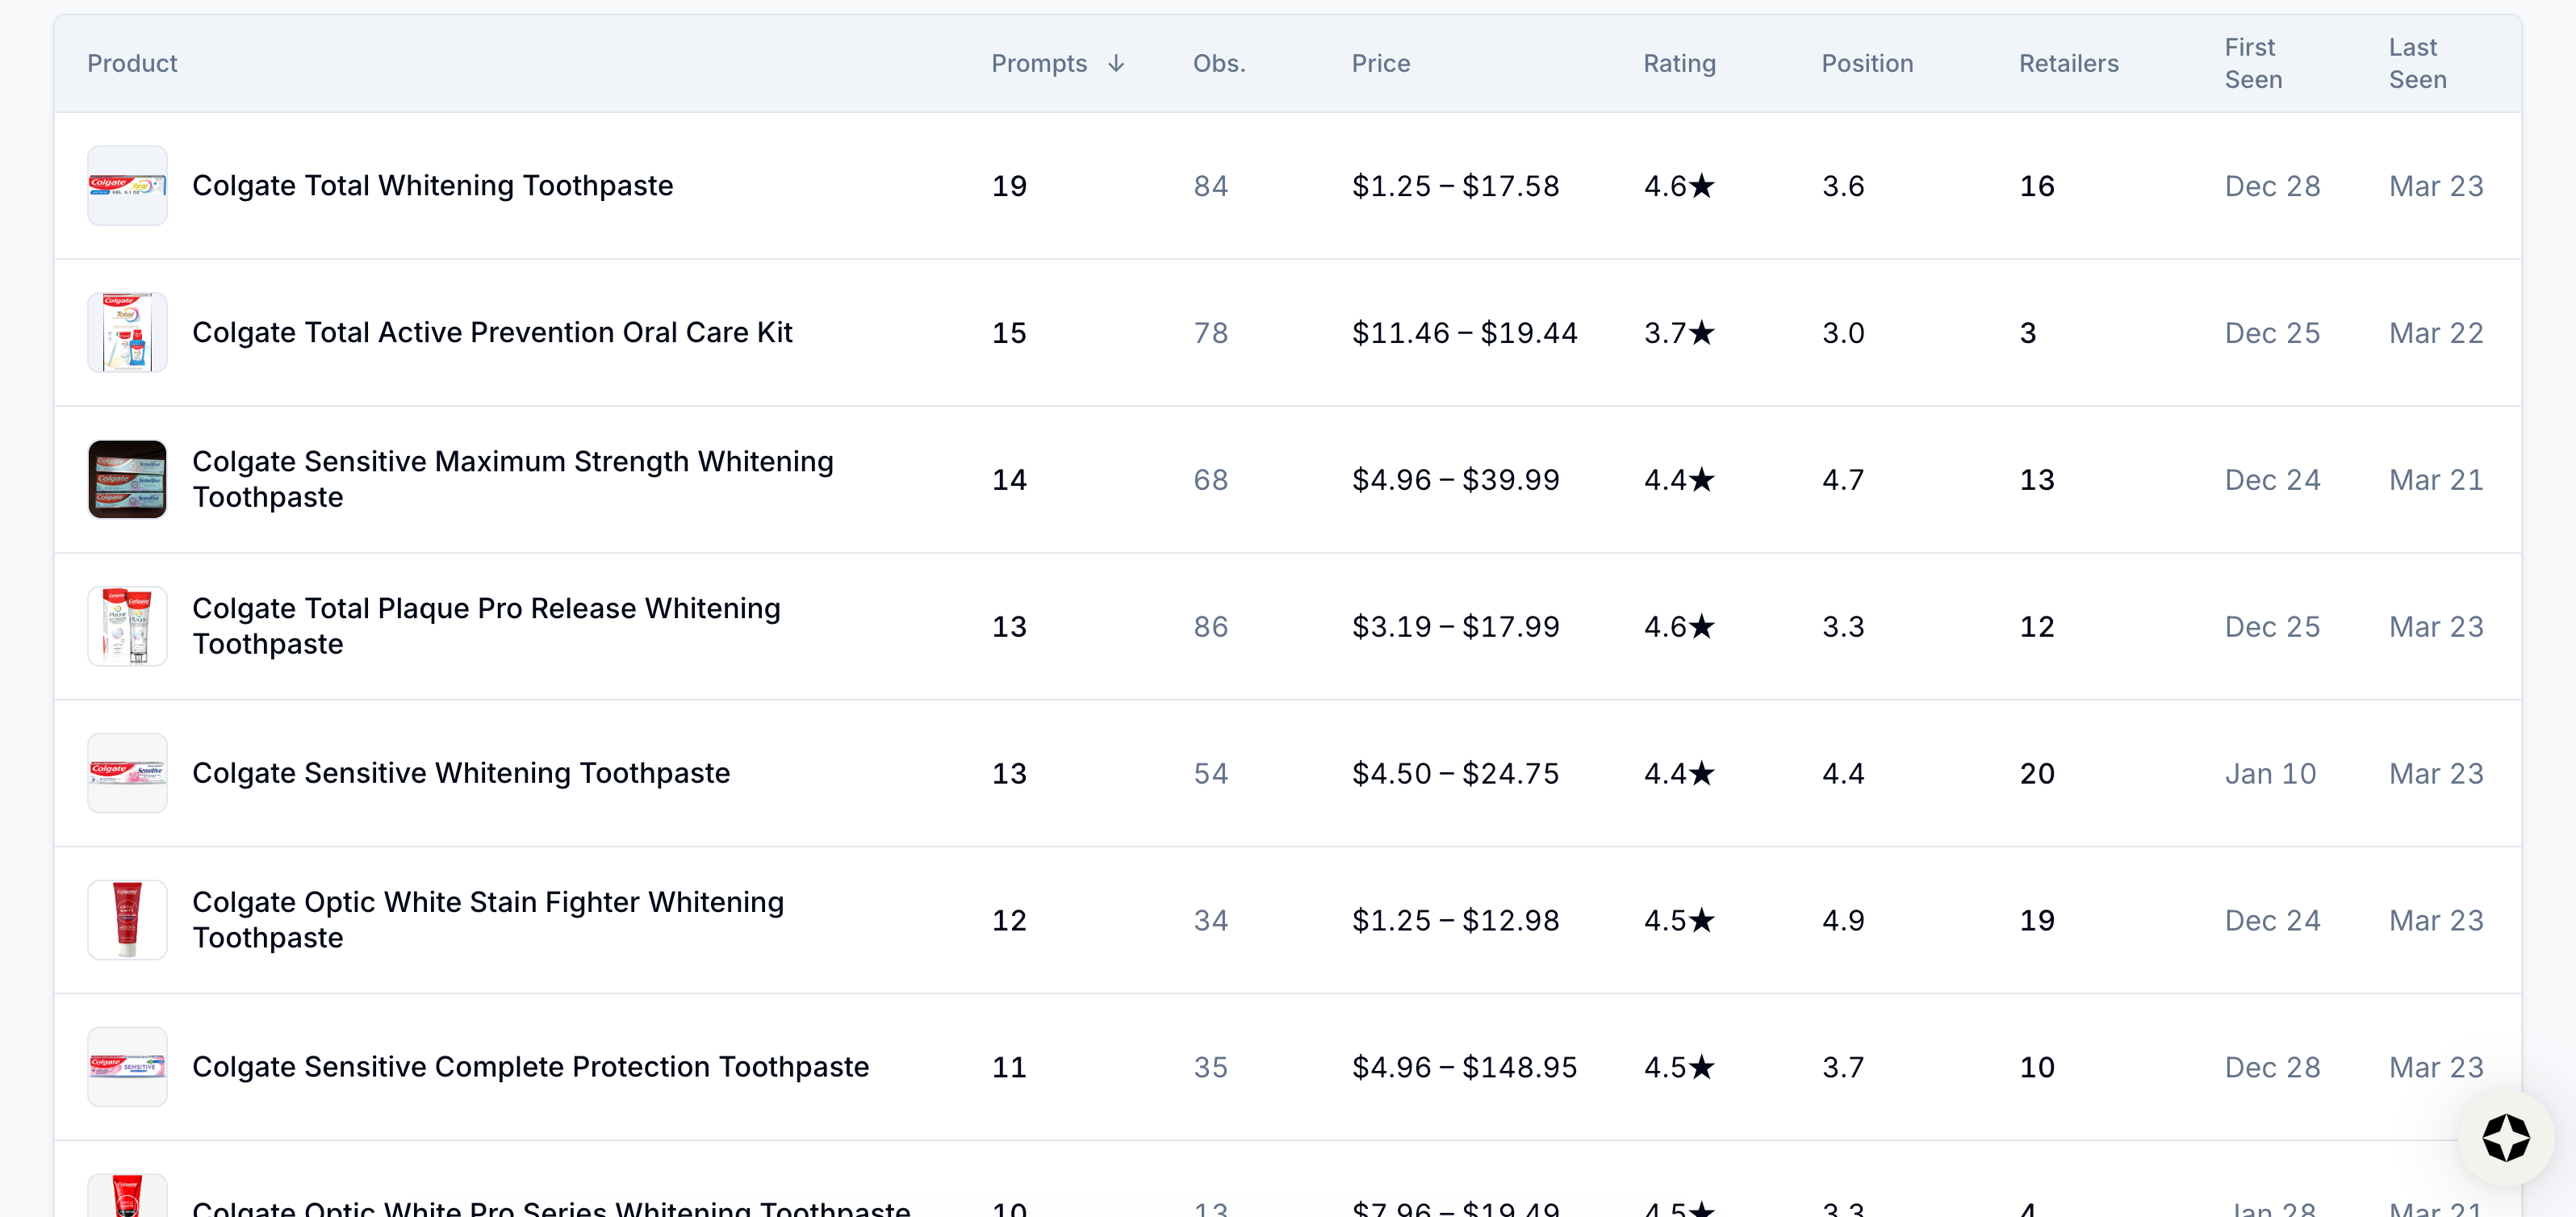
Scrunch also provides you with a sortable, searchable table of every product seen in AI shopping results, including the number of prompts and observations, price ranges, ratings, average shelf position, retailers mentioned, when it was first seen, and when it was last seen.
You can click into any product in the table to see its product detail page, including price comparison by retailer, position in shopping results over time, and the exact prompts surfacing the product.
Once you know which products are underperforming, you can prioritize where to focus your efforts—and track whether those changes move the needle.
Know who you’re up against and where you stand
Job to be done: Uncover which brands you’re competing with for AI shelf space and how you measure up, minus any manual spot-checks or DIY logging systems.
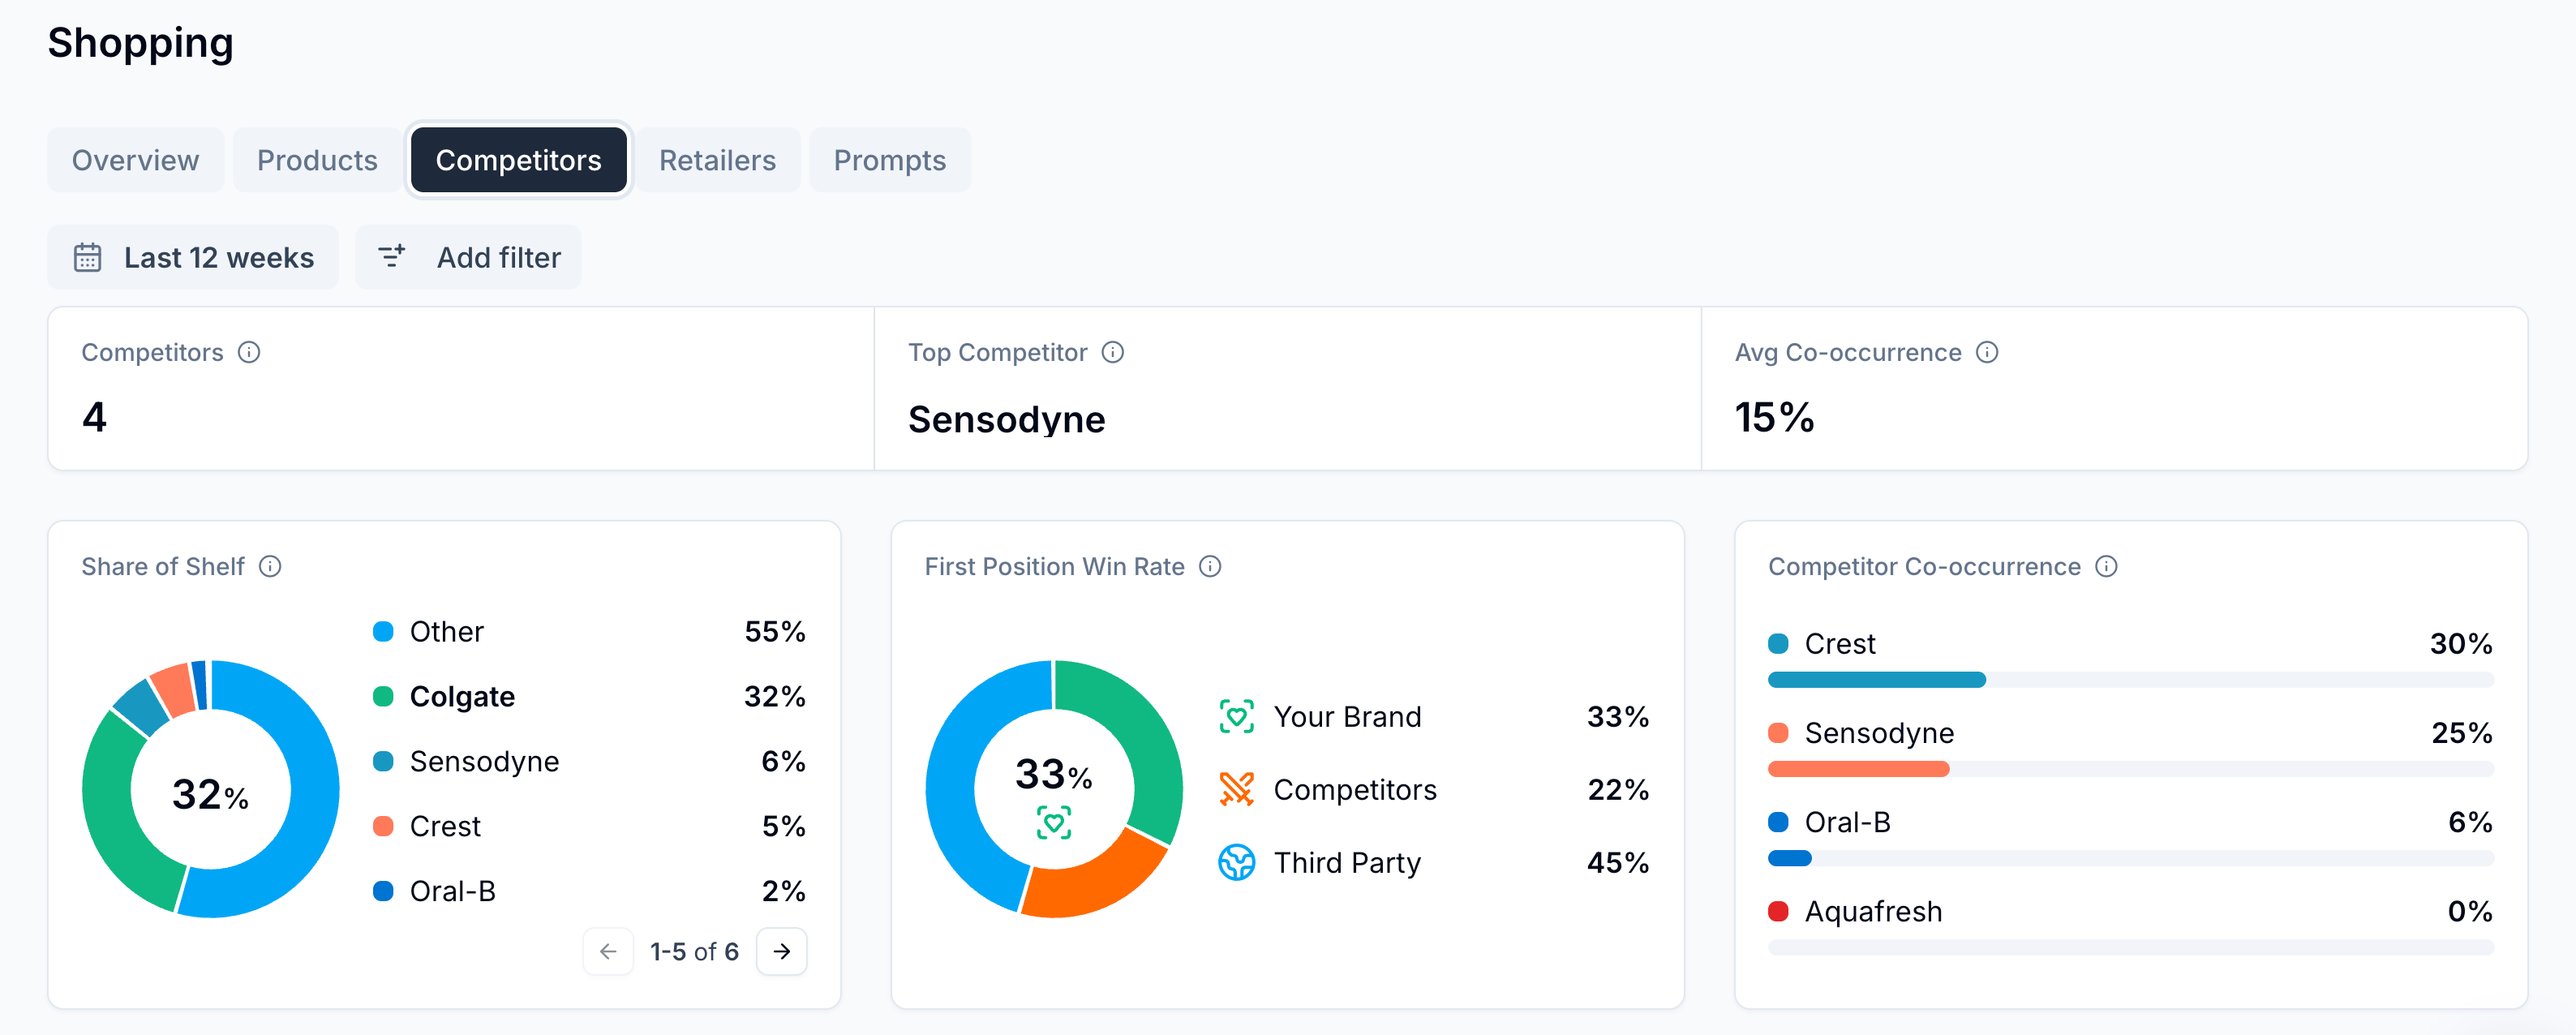
Scrunch illuminates your competitive landscape by highlighting:
- Competitors: The number of distinct competitive brands appearing alongside yours in shopping results
- Top Competitor: The competitor with the most products appearing across your shopping results
- Average Co-occurrence: How often any competitor appears alongside your brand in shopping results on average
Beyond your share of shelf, Scrunch also reveals:
First Position Win Rate
The first product recommended isn't just prominent—it's disproportionately likely to be clicked and purchased. This tells you how often you're winning that spot.
Competitor Co-occurence
Knowing which competitors consistently appear alongside your products tells you who you're actually fighting for shelf space—not just who you think you're competing with.
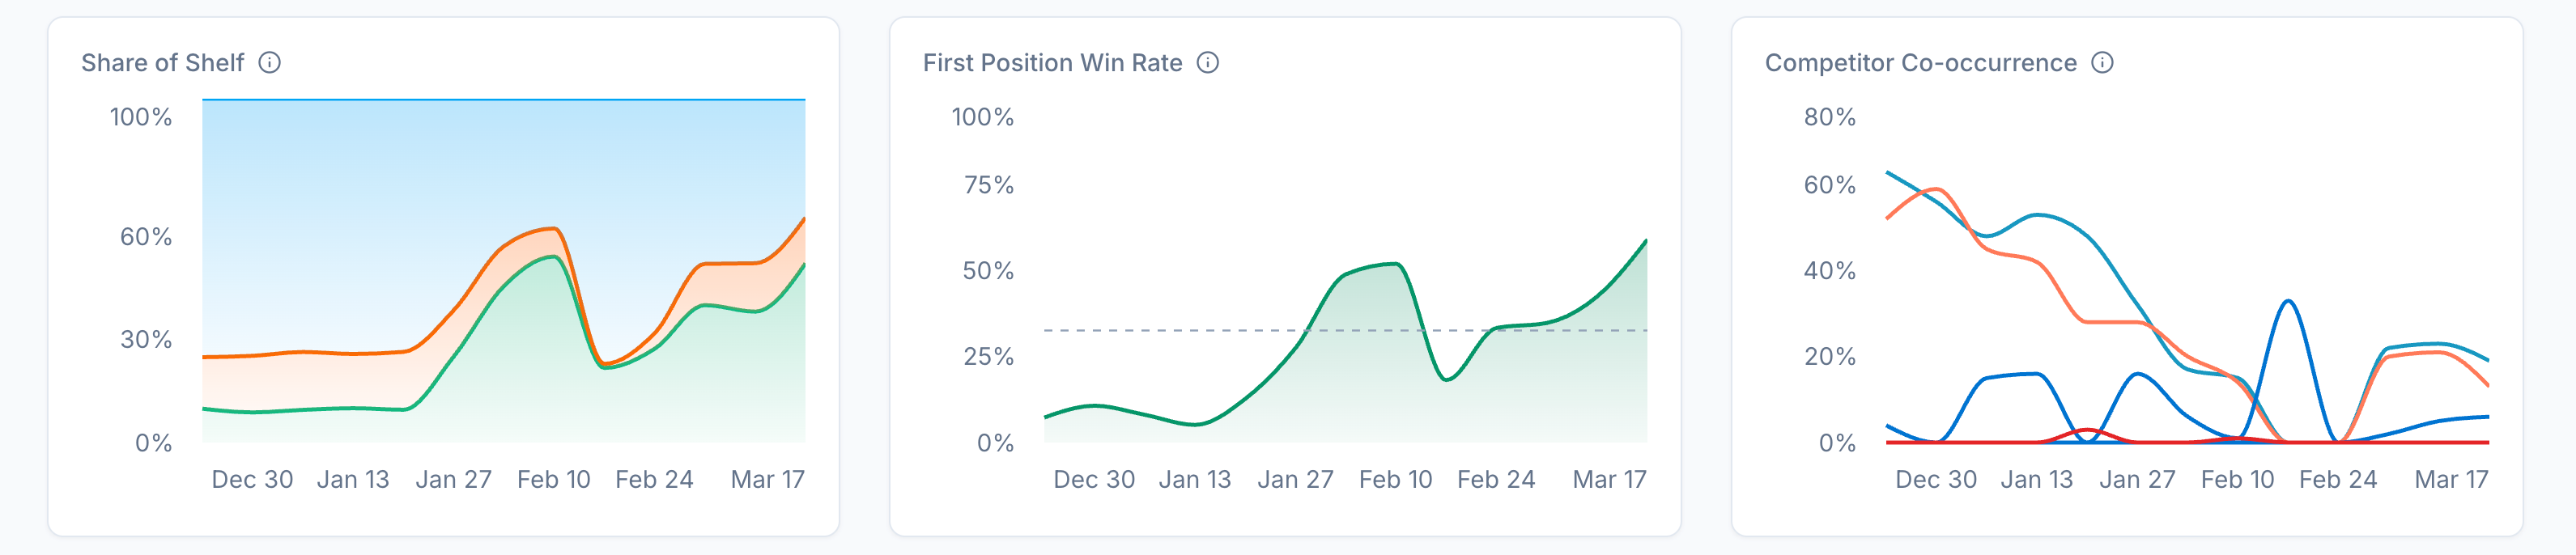
You can dig into competitive performance over time with trend line charts for every market position metric. As you update site content and launch new products, these will show you the impact on your AI search performance.
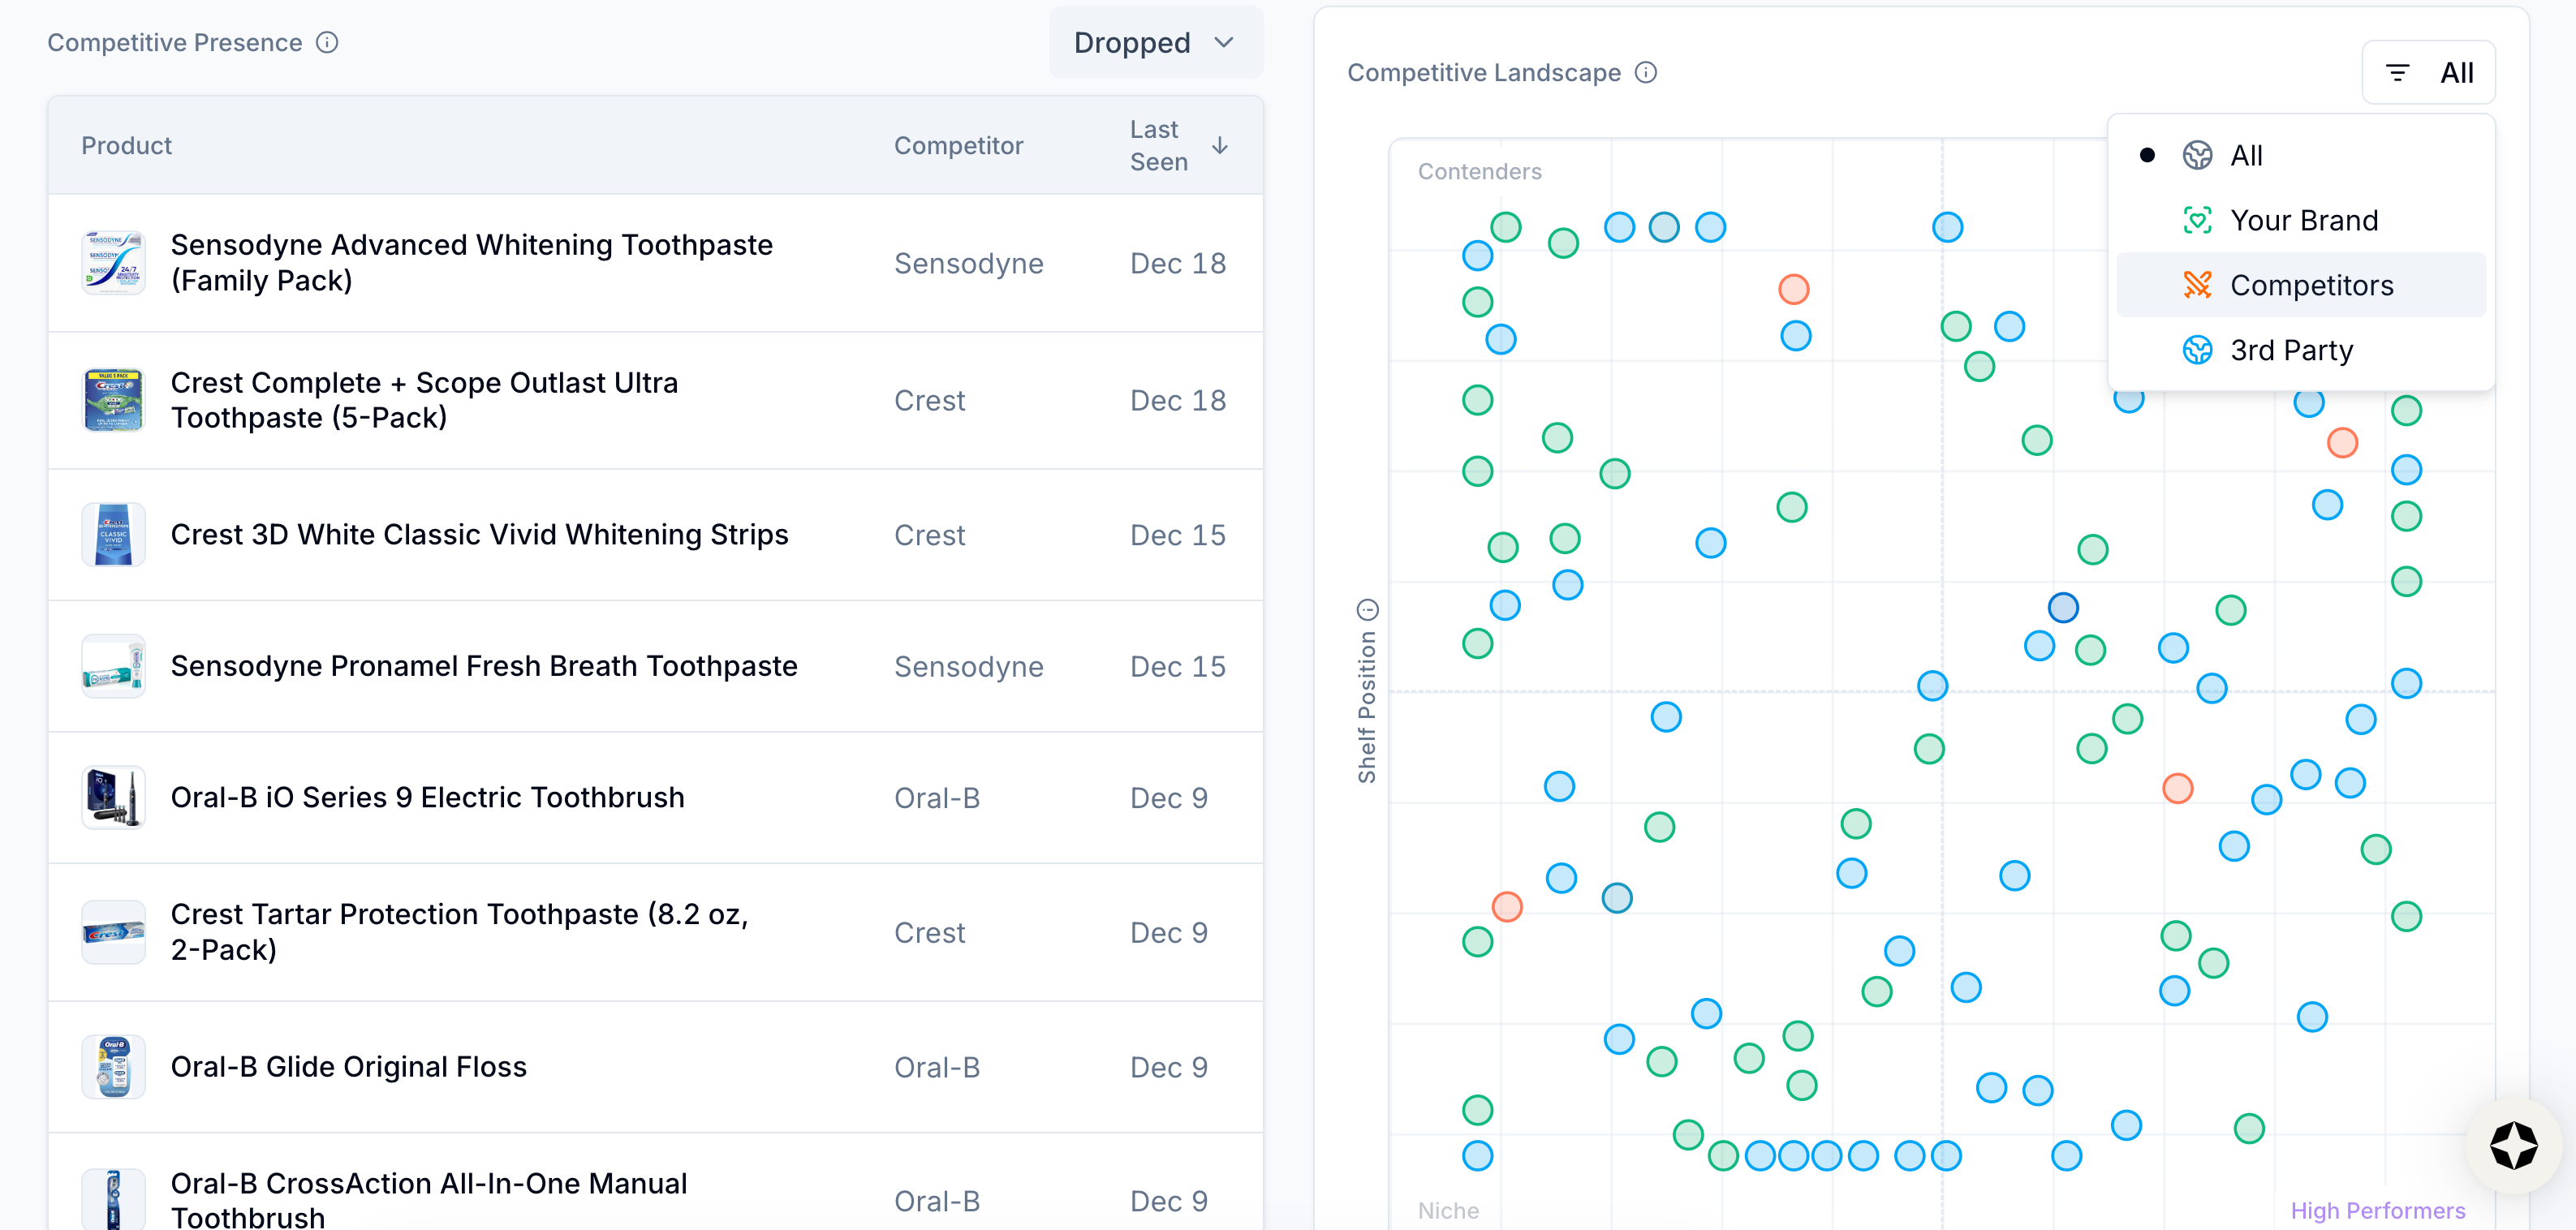
Just like with your own products, you can review which competitive products are rising or falling in visibility in AI search and dig into individual product detail pages.
You can also survey the competitive landscape via a filterable scatter plot that maps how often brand, competitor, and third-party products are observed in AI shopping results versus their average shelf position.
This shows you which products are niche, contenders, high-performers, and leaders at a glance.
Use these metrics to build the business case for where to focus future content investments.
Find out which retailers are cashing in
Job to be done: Learn which retailers are most likely to capture your AI shopping traffic and make sure the right sites are getting the sale.
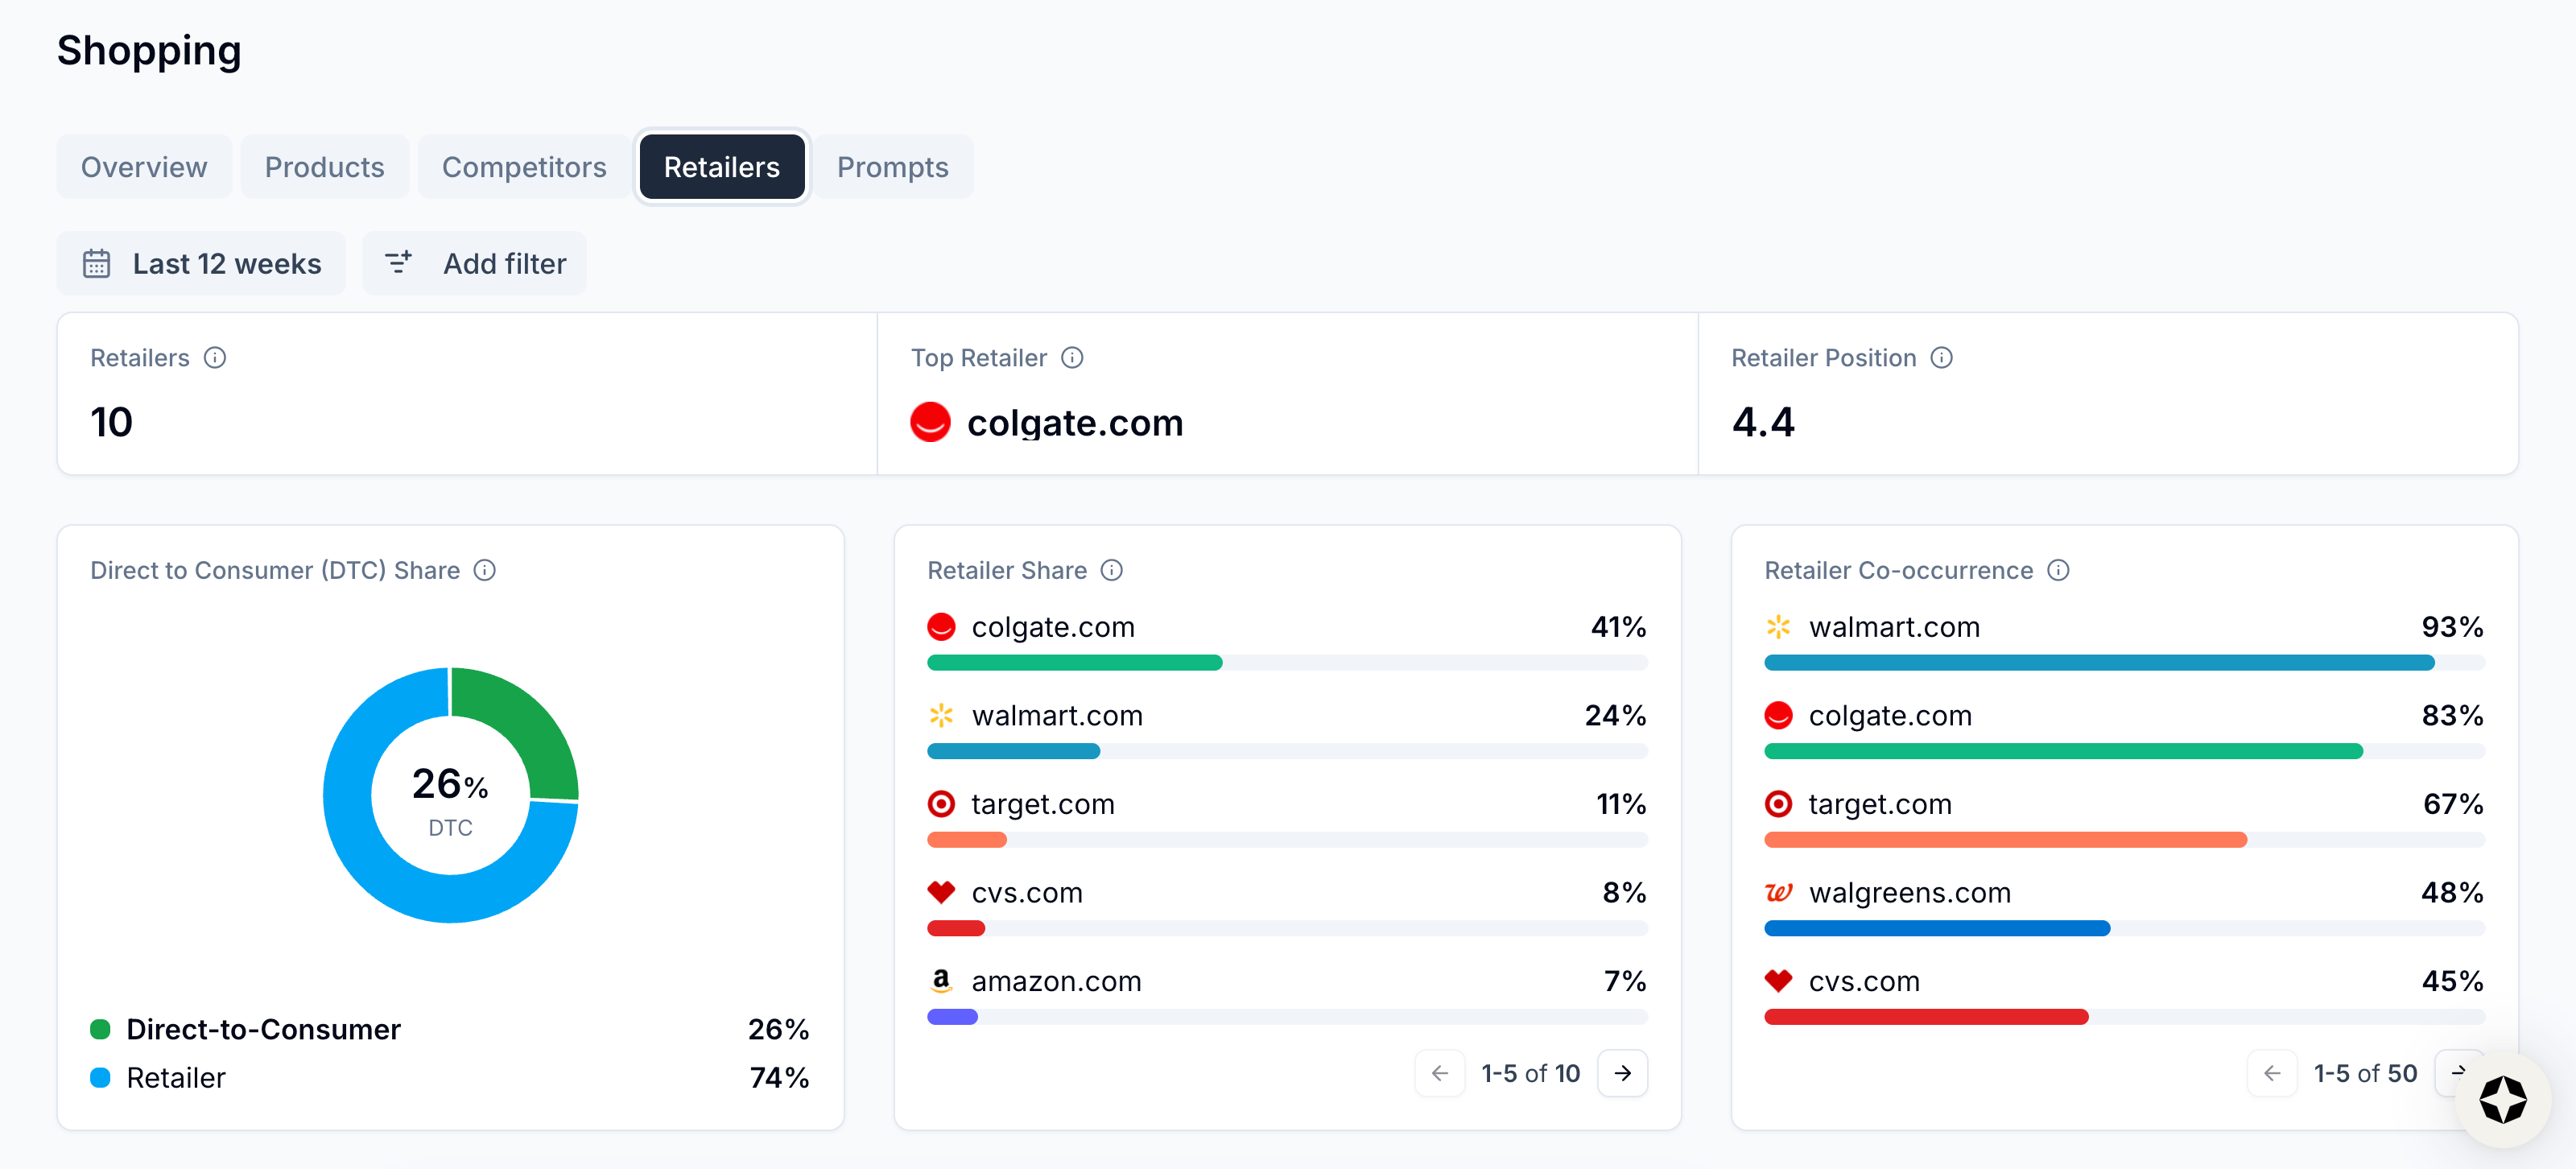
Scrunch gives you comprehensive retailer visibility by spotlighting:
- Retailers: The number of distinct retailer domains carrying your brand’s products in shopping results
- Top Retailer: The retailer domain most frequently appearing for your brand’s products
- Retailer Position: The average position your products are listed in across all retailers (the lower the number, the higher up your products are)
Scrunch also provides clear line of sight into:
Direct to Consumer (DTC) Share
Not every AI shopping result sends customers to your site. This shows you what percentage of shopping results link directly to your website versus third-party retailers, so you know which digital storefronts are getting the most digital foot traffic.
Retailer Share
Amazon might account for 60% of your AI shopping placements. Your own site, 6%. This shows you the exact split—which retailers are capturing the most AI visibility for your products and which ones aren’t registering.
Retailer Co-occurrence
Every sale that goes through a third-party retailer is one that didn't go through your site. This shows you how often each retailer carries your products across shopping results, so you can see exactly who's most likely to intercept your DTC traffic.
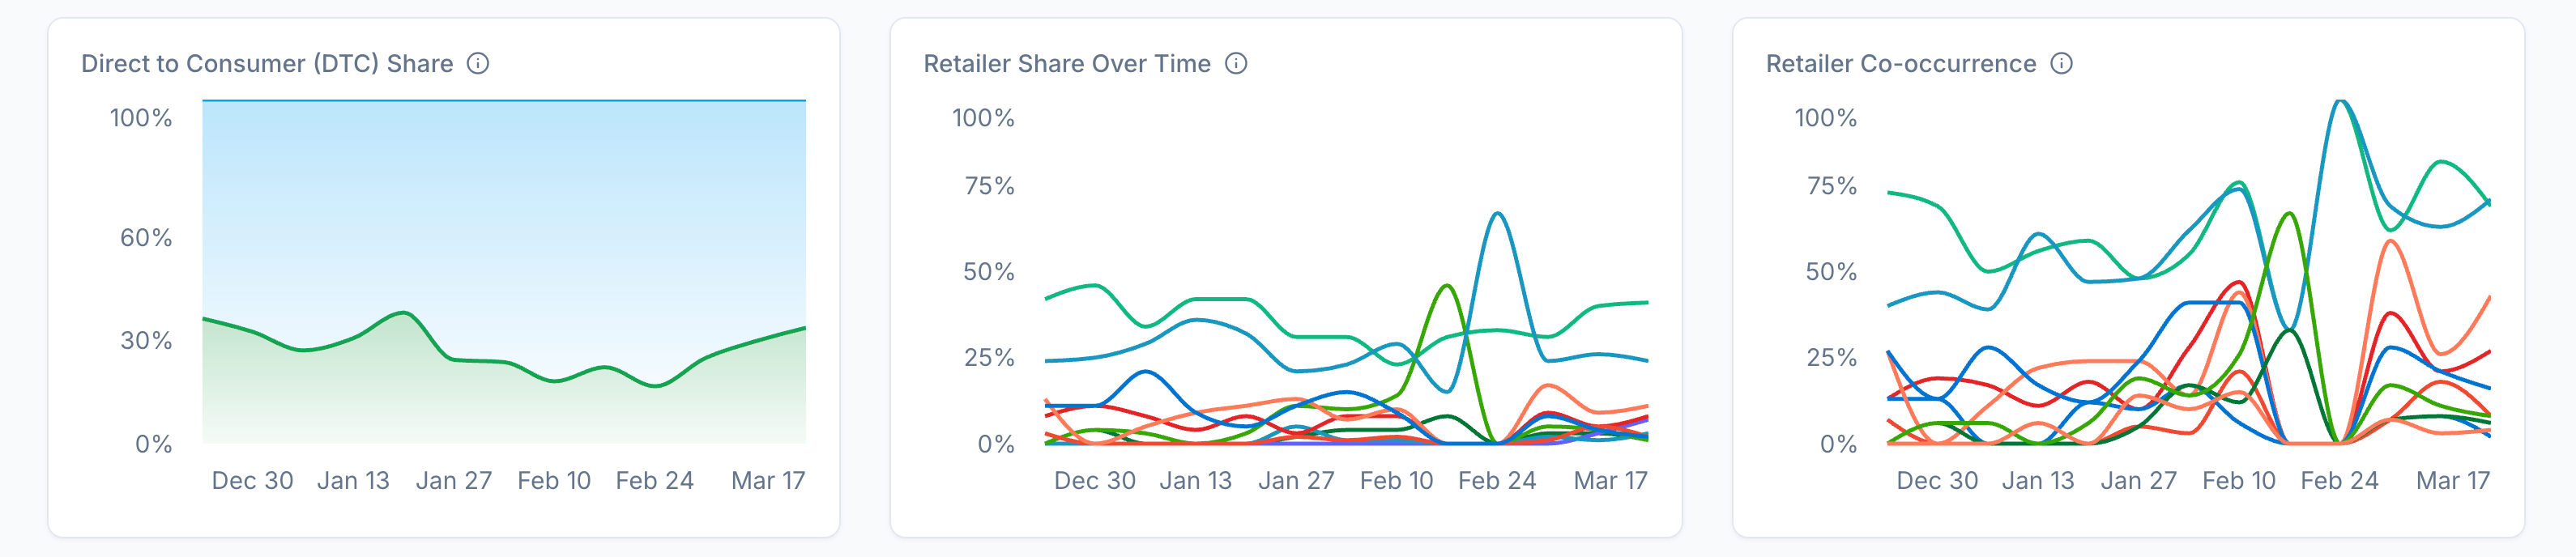
As with competitive data, all this information is viewable as a trend visualization so you can see how retailer performance changes over time.
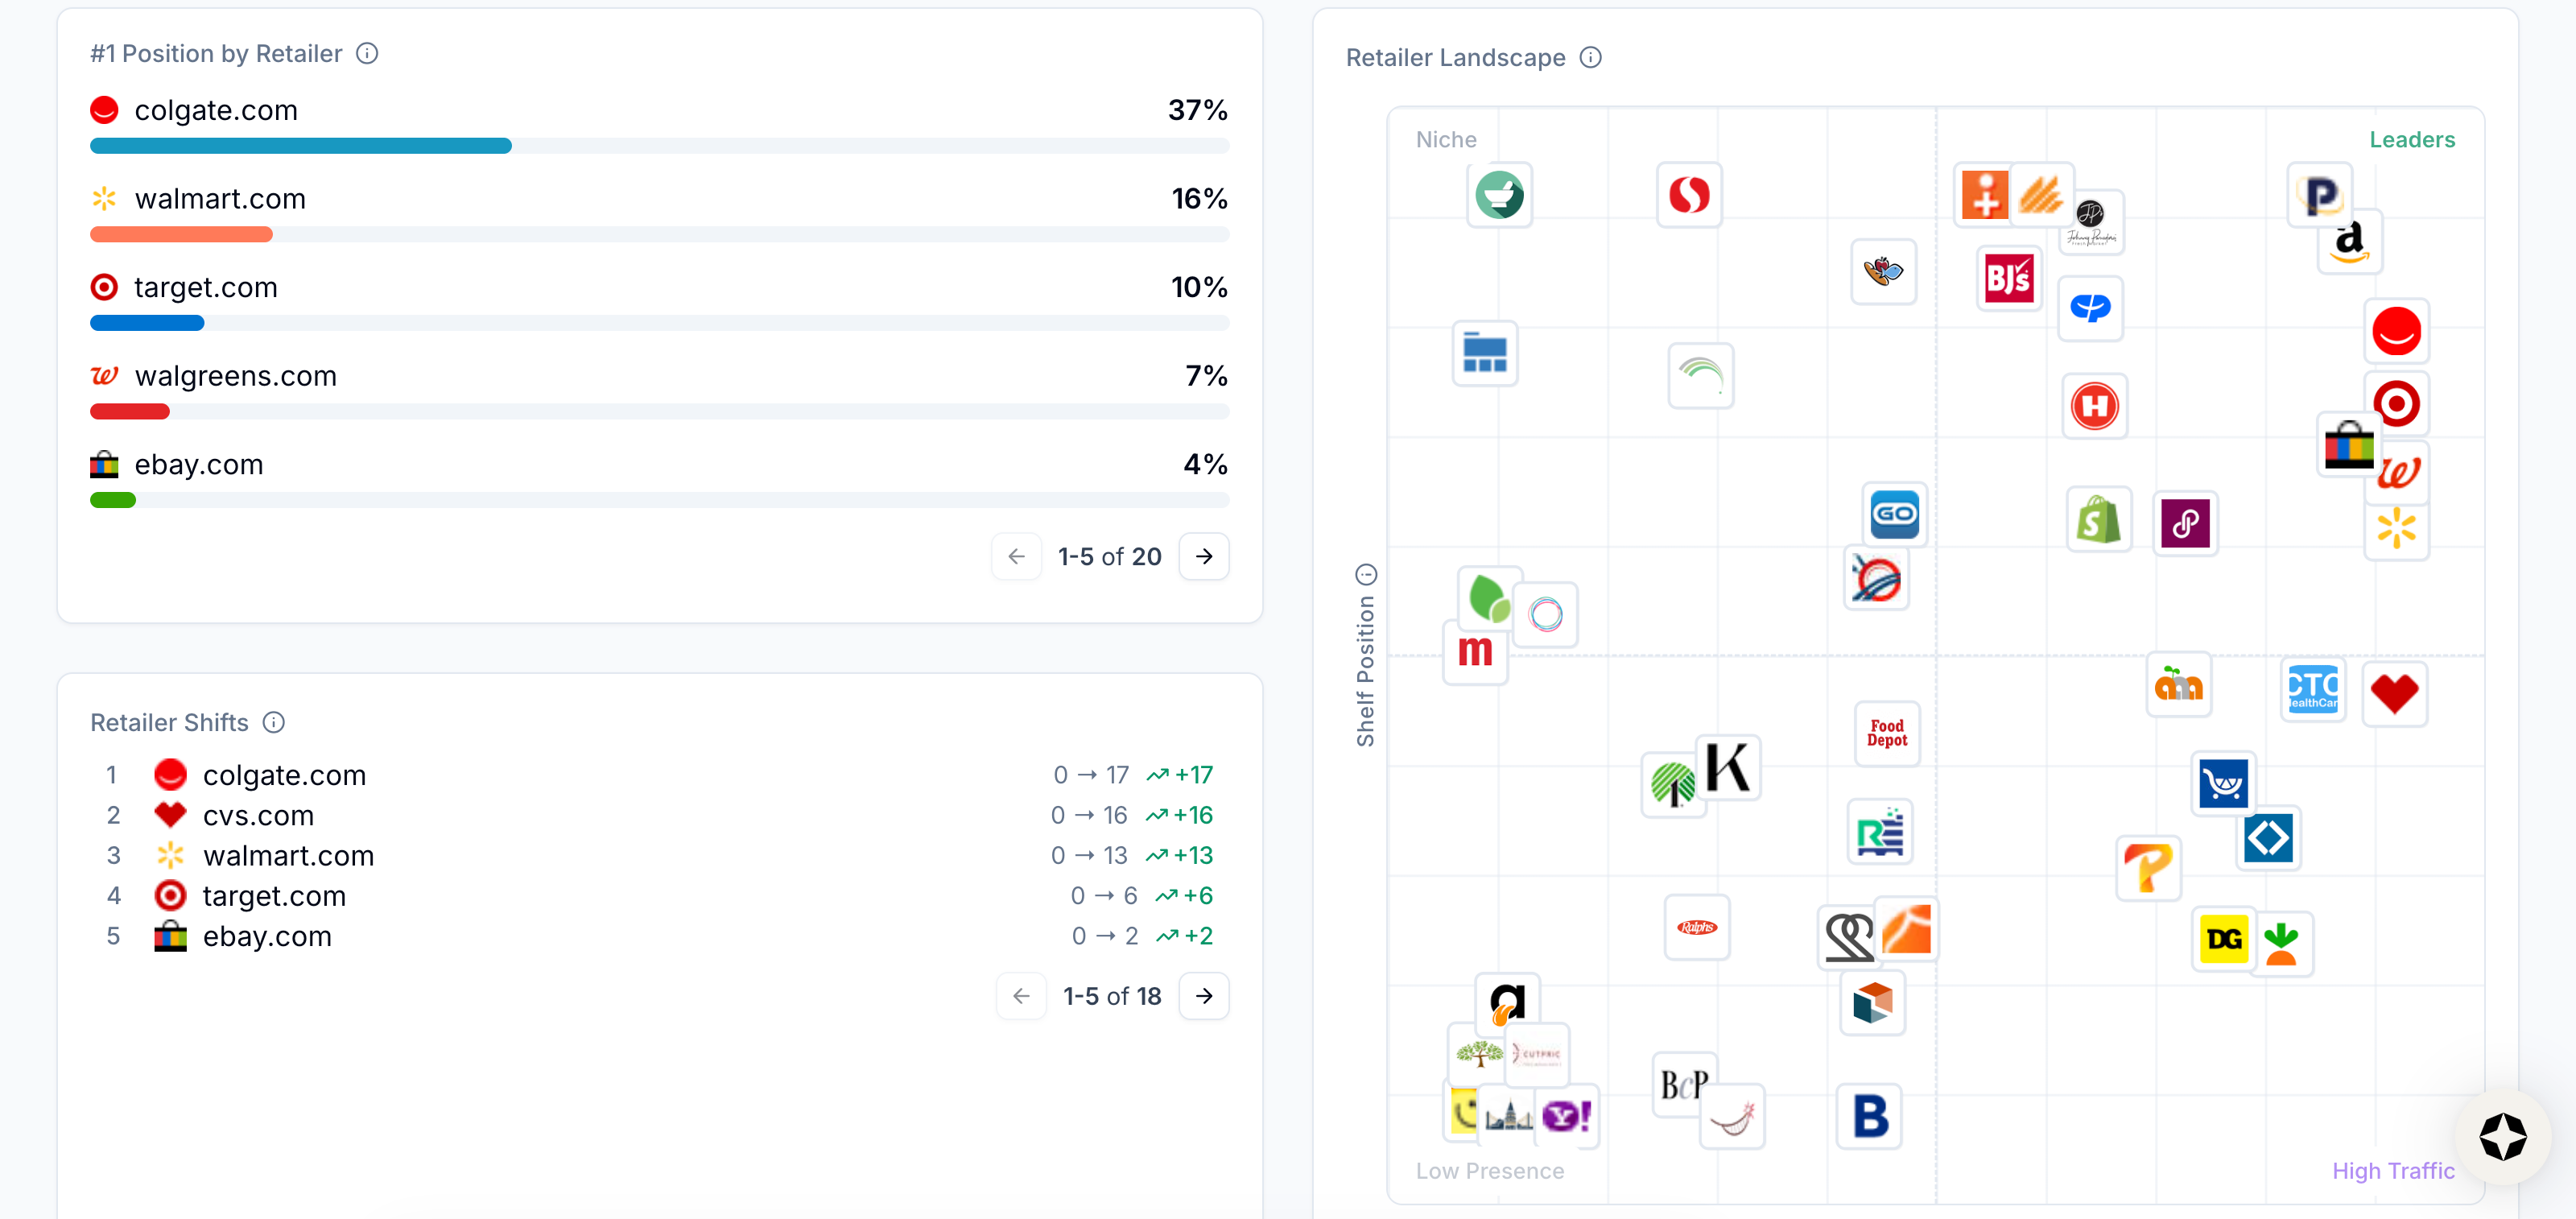
You can also see which retailers get the link when your products win the top spot in shopping results, how each retailer's share changes based on product position, and which retailers are low-presence, niche, high-traffic, or leaders across your tracked prompts.
If a retailer you don't want dominates your shopping results, that's a conversation worth having ASAP. Now you have the data to start it.
Go from ‘I see a problem’ to ‘I know exactly where to fix it’
Job to be done: Pinpoint which prompts are driving product visibility and which ones are handing the sale to a competitor so your team knows where to act first.
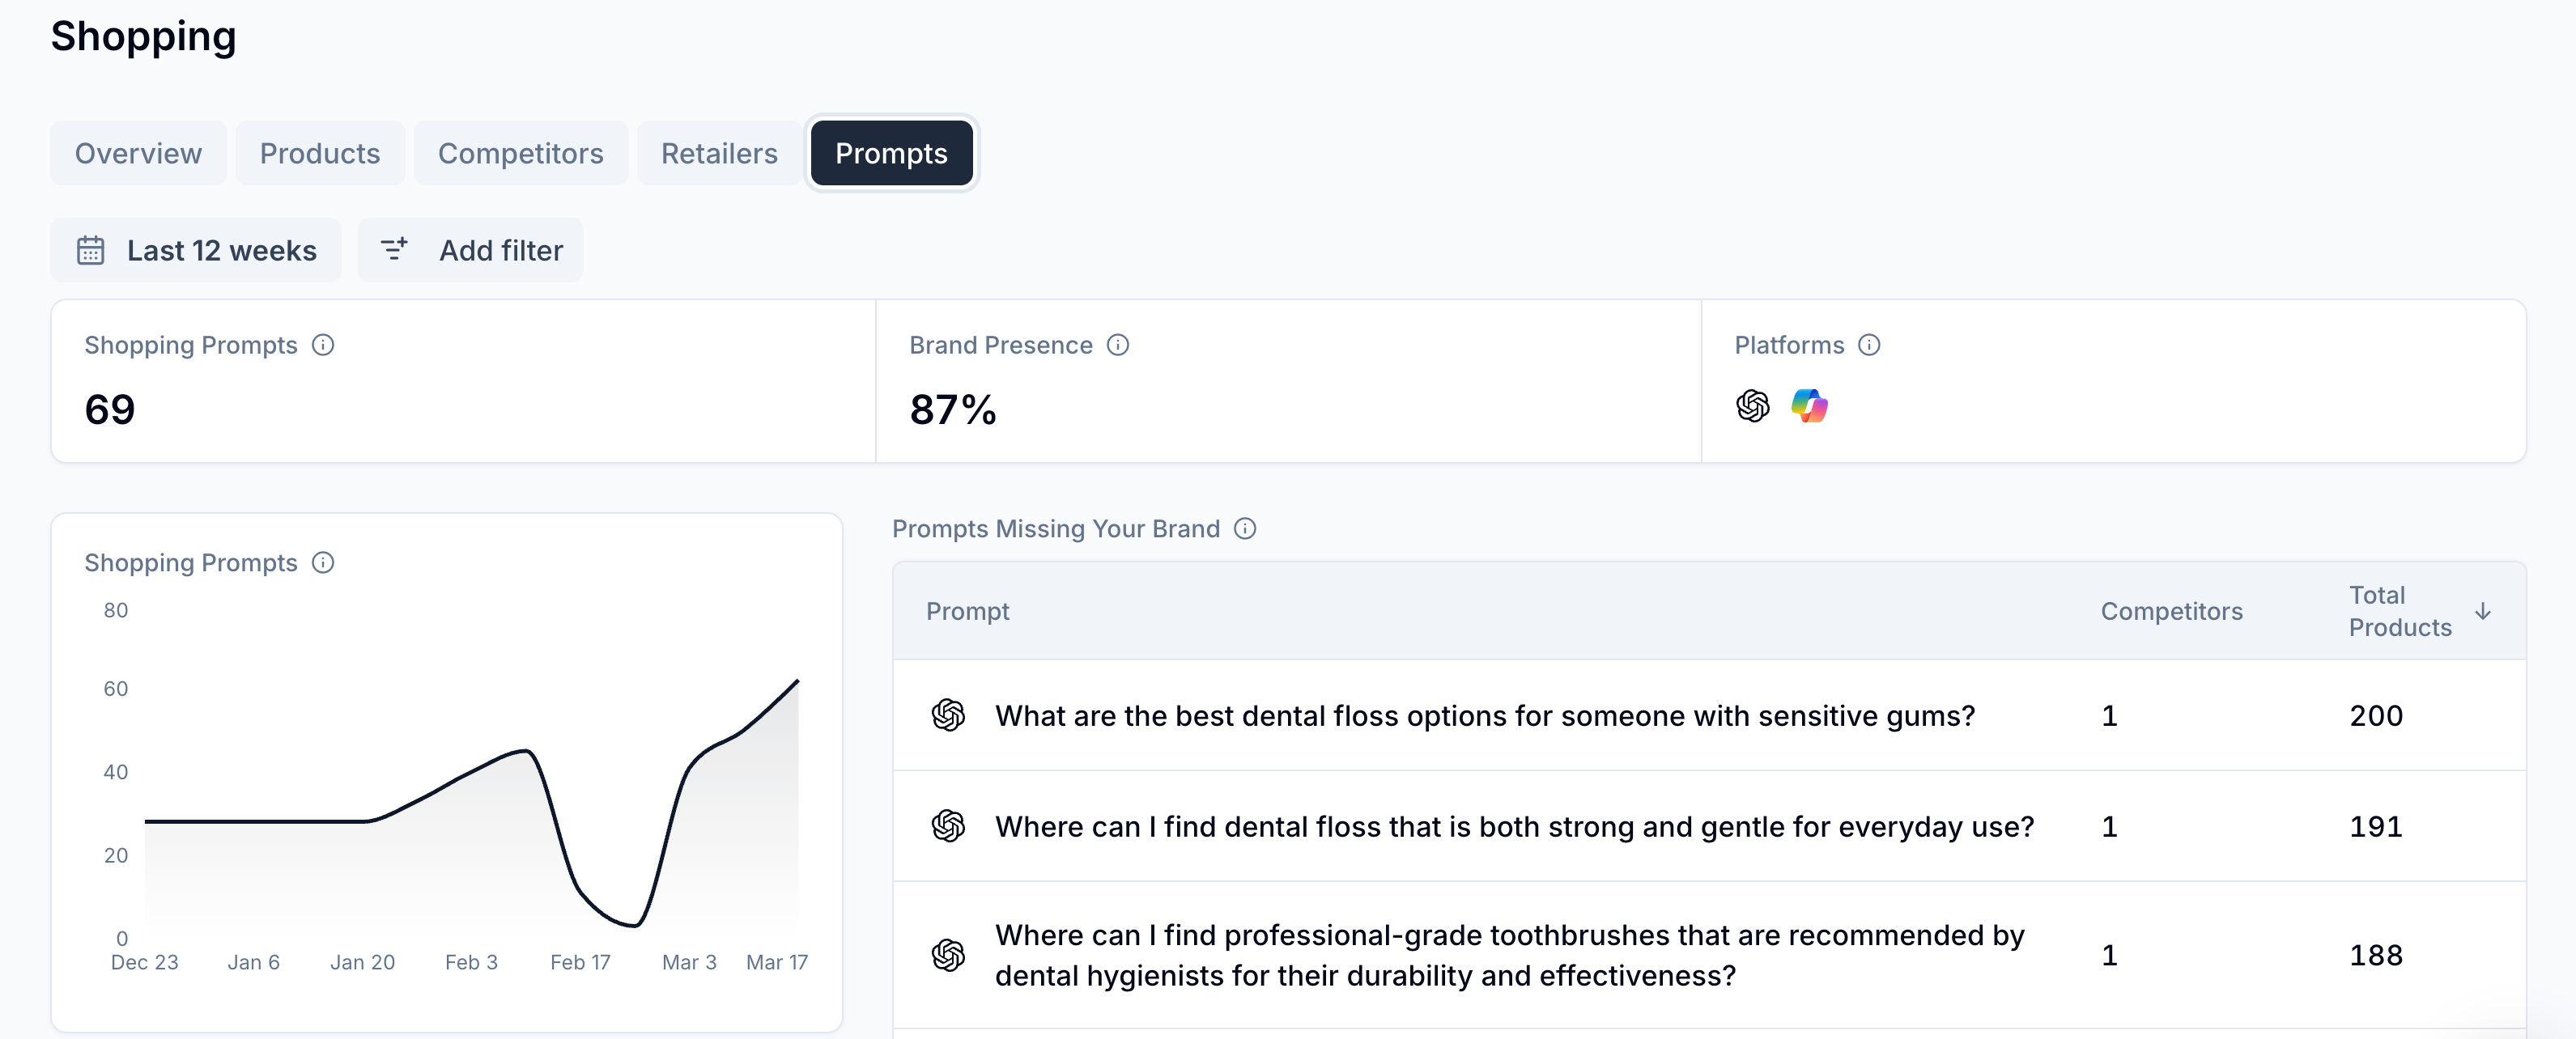
Scrunch serves up prompt-level insights derived from:
- Shopping Prompts: Number of tracked prompts that trigger shopping results across AI platforms
- Brand Presence: Percentage of shopping prompts where at least one of your brand’s products appears in results
- Platforms: Which AI platforms returned shopping results for your prompts
You can view trends related to shopping prompts and brand presence over time.
More importantly, you can see exactly which prompts a competitor’s products show up for and yours don't. This way you're never guessing where the gaps are.
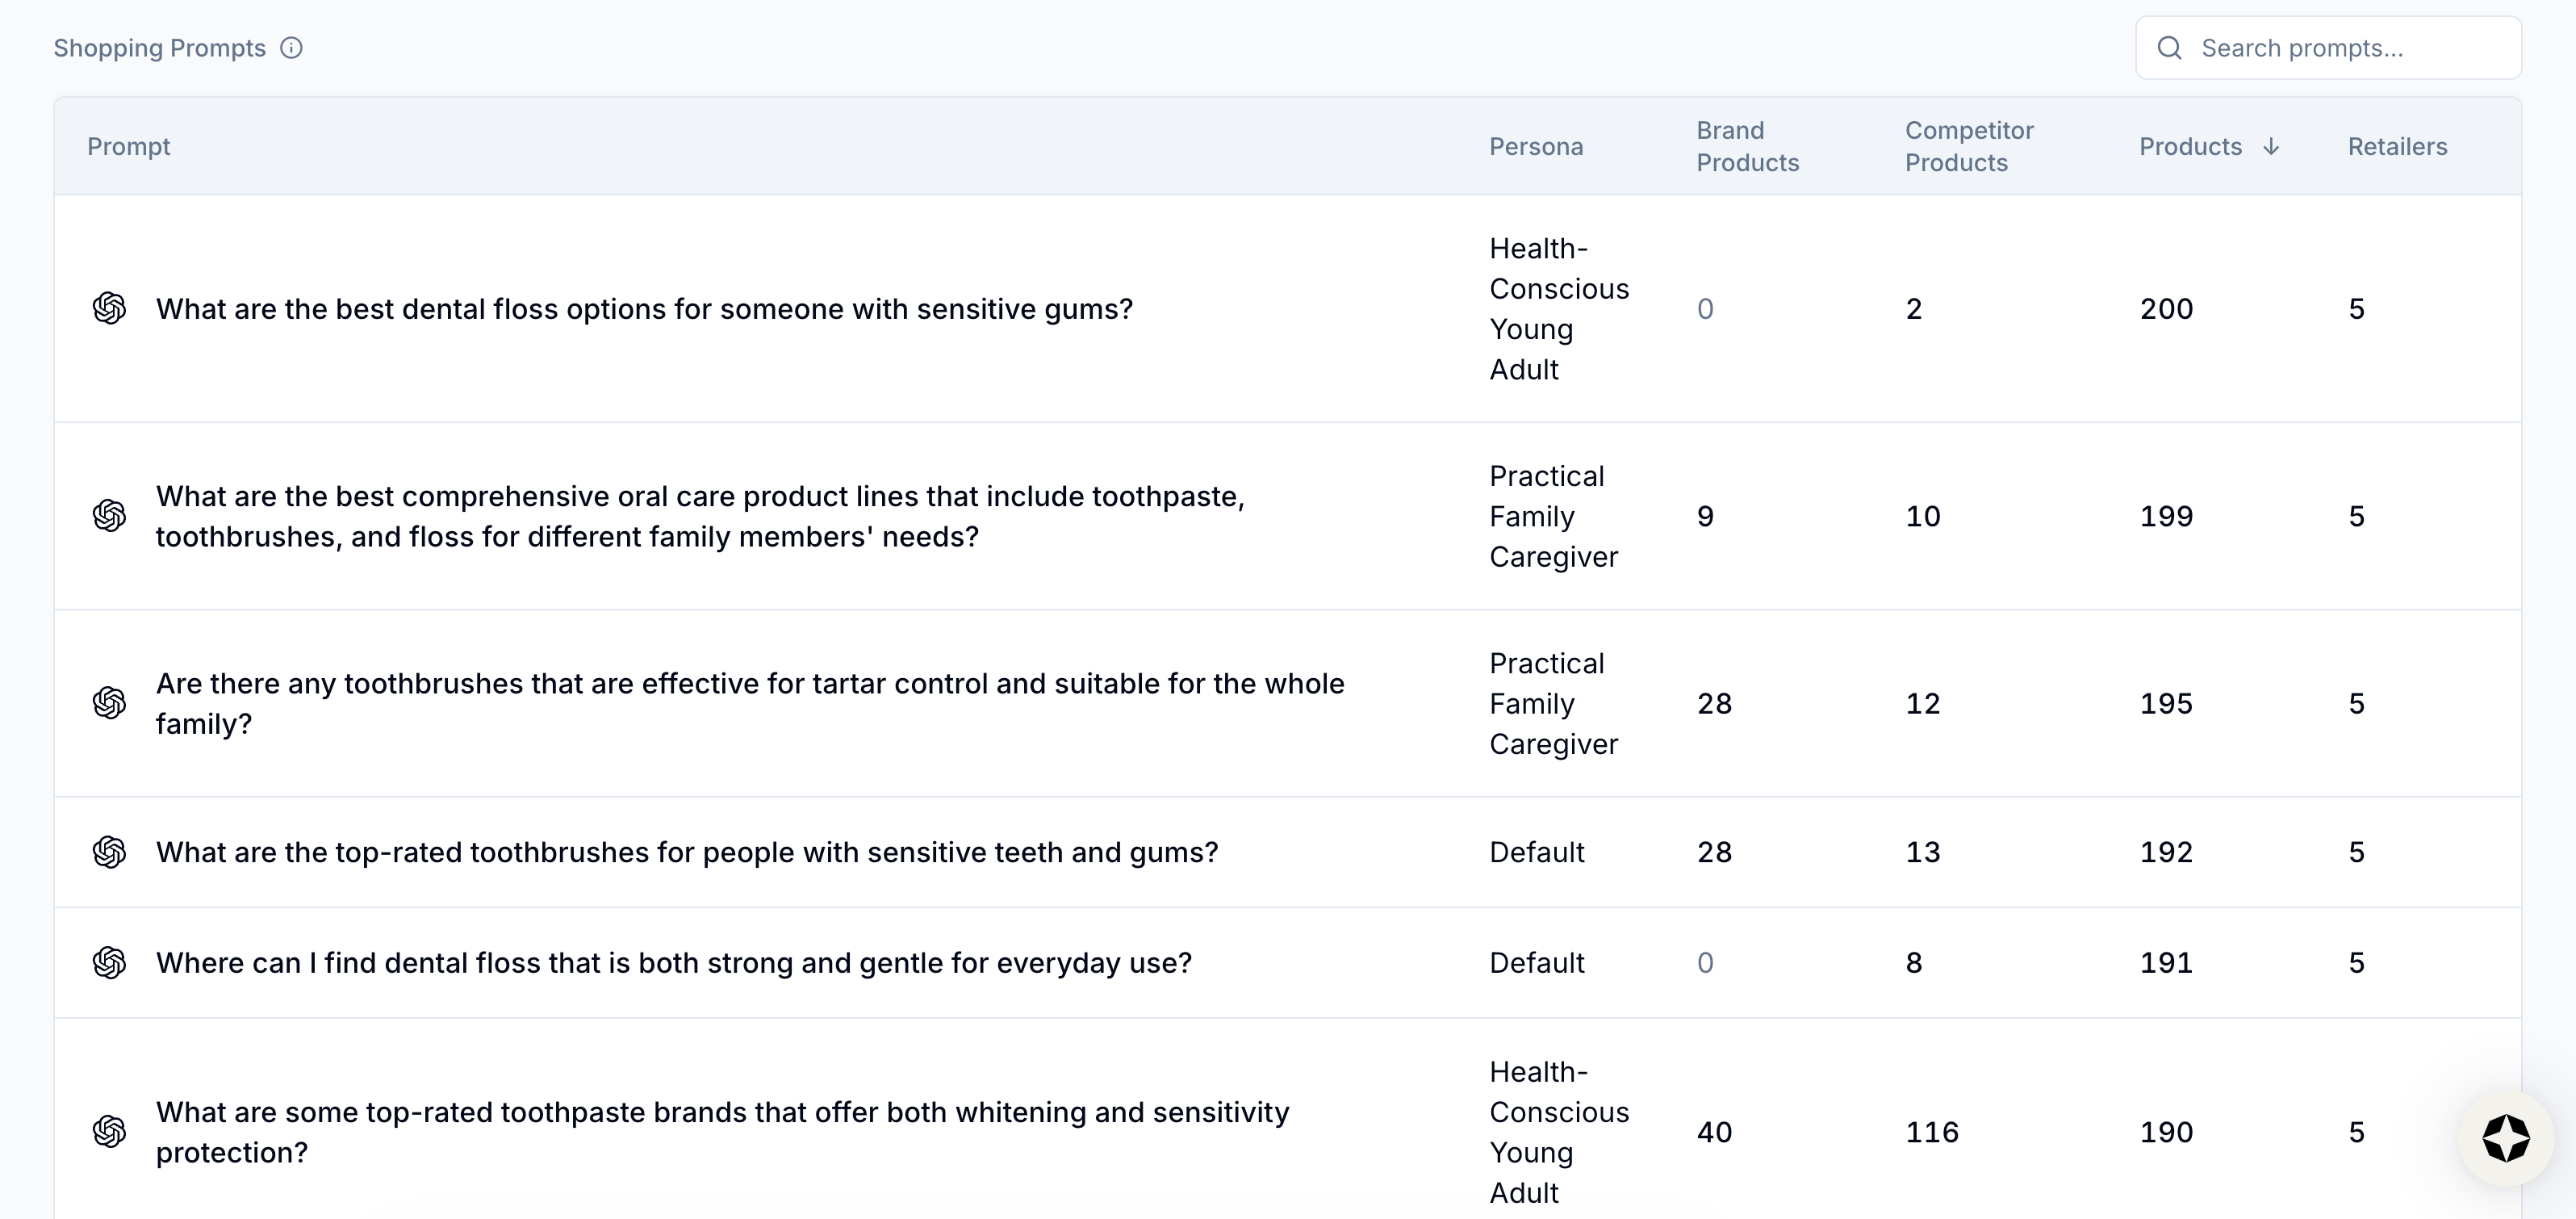
Scrunch also gives you a table of every prompt across platforms that surfaces one of your products, complete with the persona it's targeting, number of brand and competitor products present, and number of retailers on offer.
Whether it's a prompt you're winning or one you're losing, you can click into it to see the full picture.
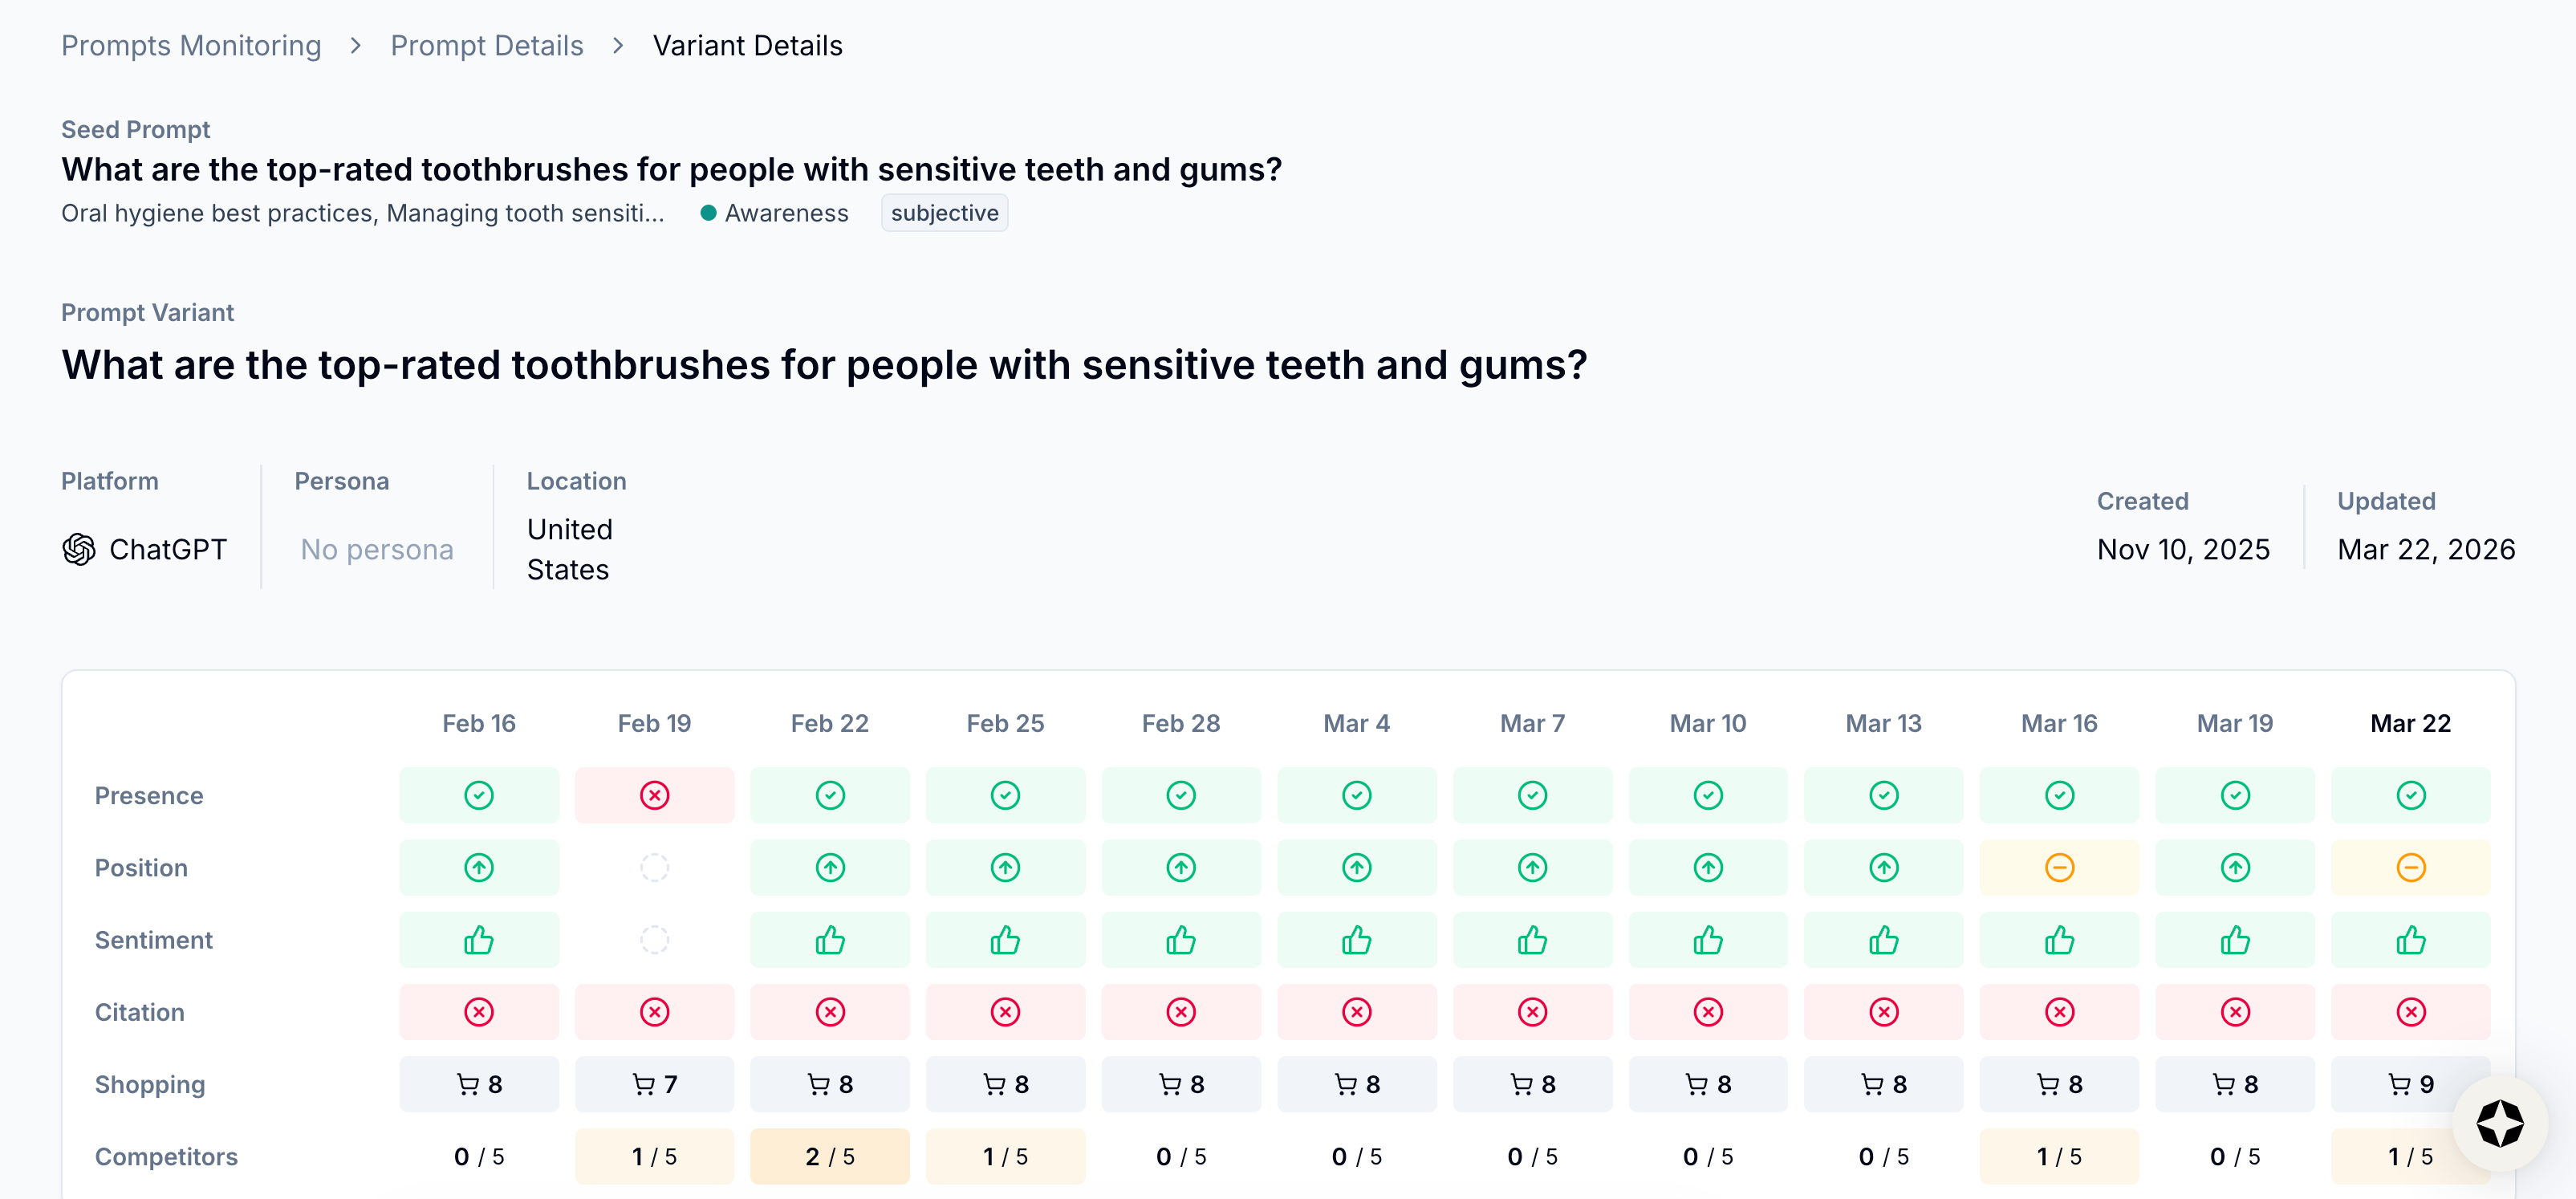
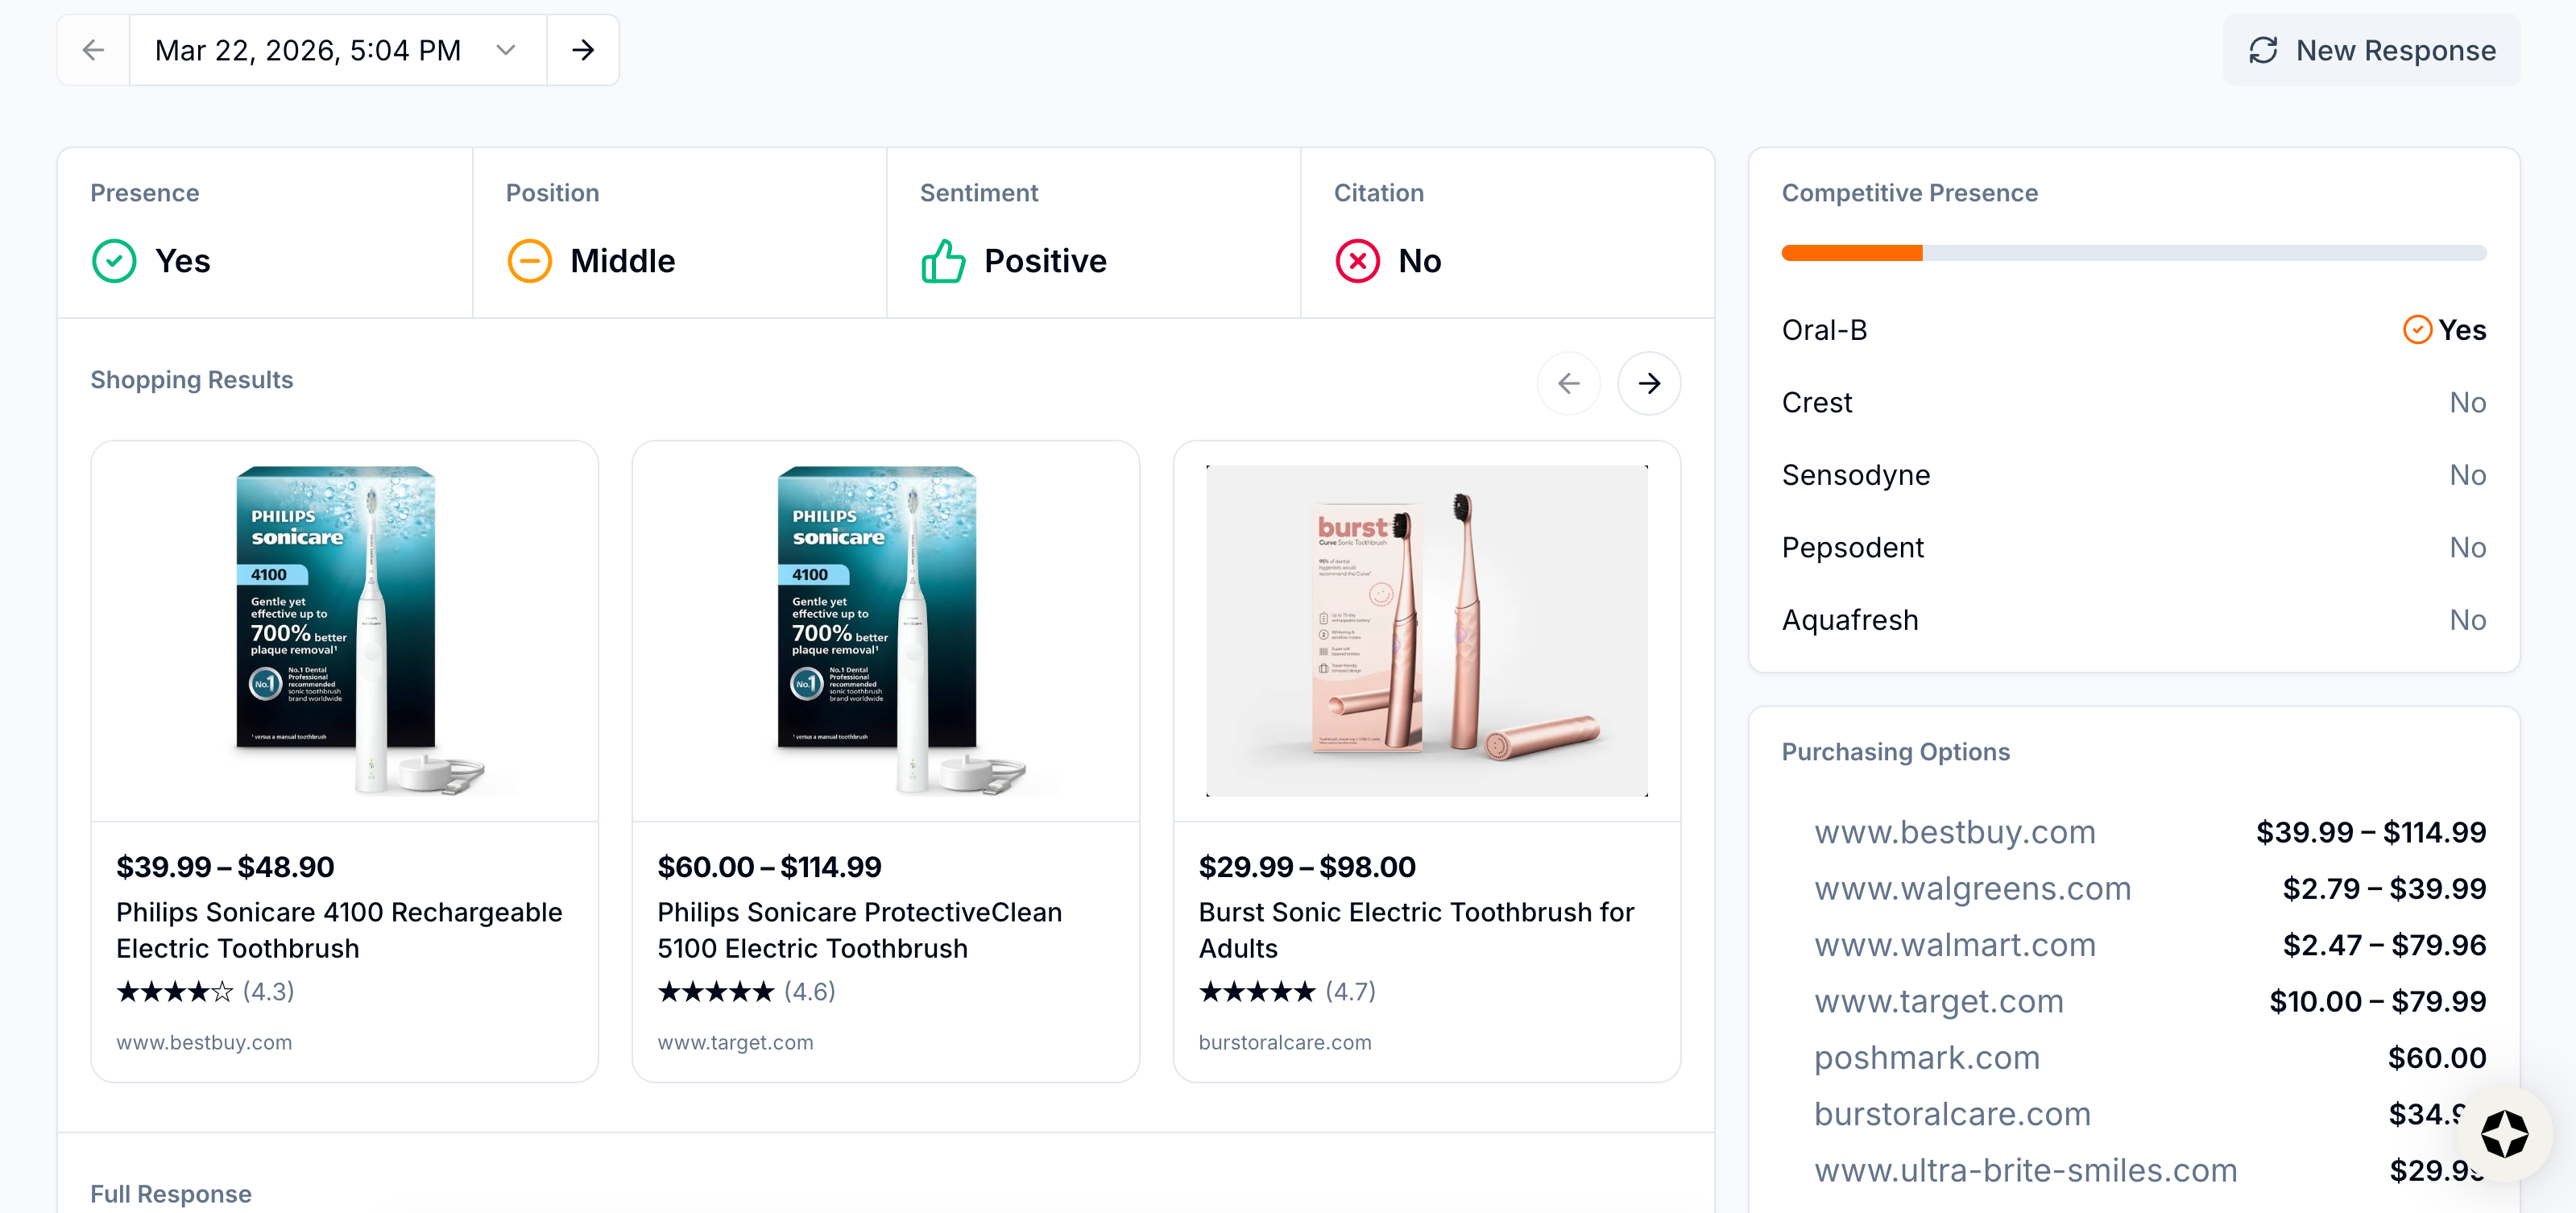
Simply click the prompt in question to visit its variant details page and see:
- A per-week shopping result indicator alongside presence, position, sentiment, citation, and competitor presence
- A real-world AI response example featuring a product carousel with images, prices, ratings, and merchant info
- A list of AI-generated purchasing options, including retailers and price ranges
Shopping in Prompts Monitoring
Shopping has also been integrated with Scrunch’s Prompts Monitoring. You can now filter data on the Prompts Monitoring page based on whether a prompt has shopping results, allowing you to narrow your entire prompt library to just shopping-relevant queries. A shopping cart icon with observation counts has also been added to each prompt row, showing how many observations include shopping data.
The prompts where competitors are winning and you're not are the ones worth fixing first. Now you know exactly which ones they are.
Make sure your products are surfaced at the moment that matters
Even if your brand is visible in AI search, your products may not be when it matters most.
Measurement at the brand level just isn't enough when recommendations happen at the product level.
You need to make sure your products show up for the right prompts at the right time—and extract the insights you need to shape AI’s shopping list.
Scrunch is here to help.
Already a Scrunch customer? Get in touch to flip the switch on our upgraded Shopping experience.
Not yet a Scrunch customer? Schedule a call with our team to learn more.
Shape AI’s shopping list with Scrunch
Start tracking your product presence. Start a 7-day free trial or get in touch to see how Shopping can help you improve your products’ share of shelf in AI search results.