


“AI prompt tracking isn't helpful because there are too many possible prompts.”
This is a sentiment I’ve heard in the market more than a handful of times. The thinking is that since there are an infinite number of always-changing prompts and AI responses, there’s no value in prompt monitoring.
This is a trap.
The real value of prompt tracking isn’t in capturing every question and answer happening across every AI platform right this second. It's in creating a consistent yardstick that reveals how your brand shows up over time for the topic areas that matter to your business.
The key part is “over time.” That’s what separates short-term fluctuations from long-term shifts.
And just like meteorologists don’t need to measure the temperature of every square foot of a city to report the weather, marketers don’t need to track each and every prompt to measure brand perception and competitor movement.
A representative and consistent set of prompts will reveal real movement even when the full universe is unobservable.
Just like weather forecasting, smart AI search strategy requires strategic measurement, consistent methodology, and monitoring for shifts.
Every prompt is a weather station
A single weather station is not the weather. But a network of them, read consistently, is a reliable trend signal.
What makes it work is not perfection, but repeatability.
In weather station networks, instrument standardization and siting are what make comparisons meaningful over time.
Prompt monitoring follows the same basic logic.
A stable set of prompts acts like a stable weather station network, allowing you to focus on direction and relative movement instead of getting hung up on a perfect census count.
If one weather station spikes while the rest stay flat, you likely have a local effect. If every station spikes, you’re likely seeing a broad shift.
Likewise, any single prompt can jump around for reasons that have nothing to do with actual demand. But a set of prompts tracked consistently for a specific topic area behaves like a benchmark.
You can use this benchmark to spot:
- Rising interest: topics heating up fast
- Falling share: visibility cooling off relative to competitors
- Fresh opportunities: new questions where you can establish authority
- Emerging threats: competitors showing up more often in answers you want to win
Measurement is a model, not a mirror
It’s important to remember that measurement is a model of reality, not reality itself.
At the risk of complicating things with another analogy: You don’t want to confuse your map for the actual territory you’re navigating.
In prompt monitoring, your “map” is your measurement setup:
- A prompt is a single weather station reading (i.e., “What’s the weather in Chicago right now?”).
- A topic is a regional station network: the set of prompts you treat as one theme over time (i.e., “What’s the weather in the Midwest over summer?”)
- A metric (brand presence, position, sentiment, citation share, etc.) is the weather variable you read from each station (i.e., “What’s the temperature, humidity, wind, precipitation, or pressure?”).
And remember: Weather networks aren’t just found—they’re built.
Your assignment rules (i.e., taxonomy and topic mapping) are your weather station siting. They decide:
- Which prompts “count” for a topic
- Where measurements are taken
- What gets averaged together
So when something moves, there are always at least two possibilities:
- The weather changed (real user behavior shifted).
- Your map changed (you moved your stations, added stations, changed what counts as part of a region, etc.).
Steal the meteorologist's playbook for prompt monitoring
If you want AI search insights you can depend on, do what the meteorologists do:
Standardize your instruments and keep your network calibrated
In weather monitoring, accuracy is less about a “perfect” sensor and more about comparability: Instruments are standardized and shielded from obvious bias, and stations are sited consistently so readings mean the same thing over time.
A Stevenson screen is the classic example: It protects instruments from direct radiation while still allowing air to circulate, reducing measurement distortion from the environment around the sensor.
Prompt monitoring works in the same way. Your prompts are the instruments, your topics are the station networks, and your assignment rules are the siting. If they change, your measurements can shift even if the underlying world didn’t.
What that means in practice:
- Shield your instruments: Keep prompts neutral and repeatable (avoid leading wording, stacked assumptions, and weird edge cases).
- Keep your instruments consistent: Don’t “tune” prompt phrasing every week—stability is what makes trends comparable.
- Keep your network consistent: Hold your prompt set, topic definitions, and assignment rules steady so the same reading means the same thing month to month.
Normalize and benchmark to separate signal from noise
Meteorologists don’t panic when the temperature changes. They ask: “Is this unusual for this place and this time of year?”
In weather and climate, normal is the expected baseline pattern for a location and season. An anomaly is the difference between what you observed and what’s normal.
Prompt monitoring needs the same mindset, because many shifts are driven by context: seasonality, news cycles, outages, platform changes, etc.
If you only look at raw levels, you’ll end up “discovering the calendar” instead of real insights.
Don’t just ask if a metric is up. Ask if it’s up relative to what’s expected, and relative to peers under the same conditions.
What this means in practice:
- Use rolling baselines per topic (e.g., trailing 8–12 weeks) and report the anomaly (what’s observed minus what’s expected).
- Benchmark against peers and competitors across the same prompts, the same weeks, and the same surfaces so that broad shocks cancel out (just like checking nearby weather stations!).
- Make peer-relative movement your default readout. As in, did you move or did the whole market move?
Don’t over-index on hotspots
Hotspots are useful for discovery. They’re dangerous as a baseline.
The problem is subtle: Once you start chasing spikes, you change what you measure. If you keep adding weather stations wherever the storm looks biggest, your network will slowly turn into a storm detector, not a stable read on the broader climate.
That’s why weather networks obsess over consistent siting: Moving sensors or putting them near biasing surfaces can create trends that are really just measurement artifacts.
The same thing can happen in AI visibility data.
Real behavior is lumpy and uneven across topics, platforms, competitors, and time frames, so whatever is spiking right now is naturally volatile.
And visibility can create its own momentum: Showing up more drives more discovery, which drives more prompts and mentions, which makes you look even more visible.
Hotspots are where you find narratives. Benchmarks are where you test whether they’re real.
Use spikes to guide investigation, then “graduate” what matters into a stable prompt set and measure it there.
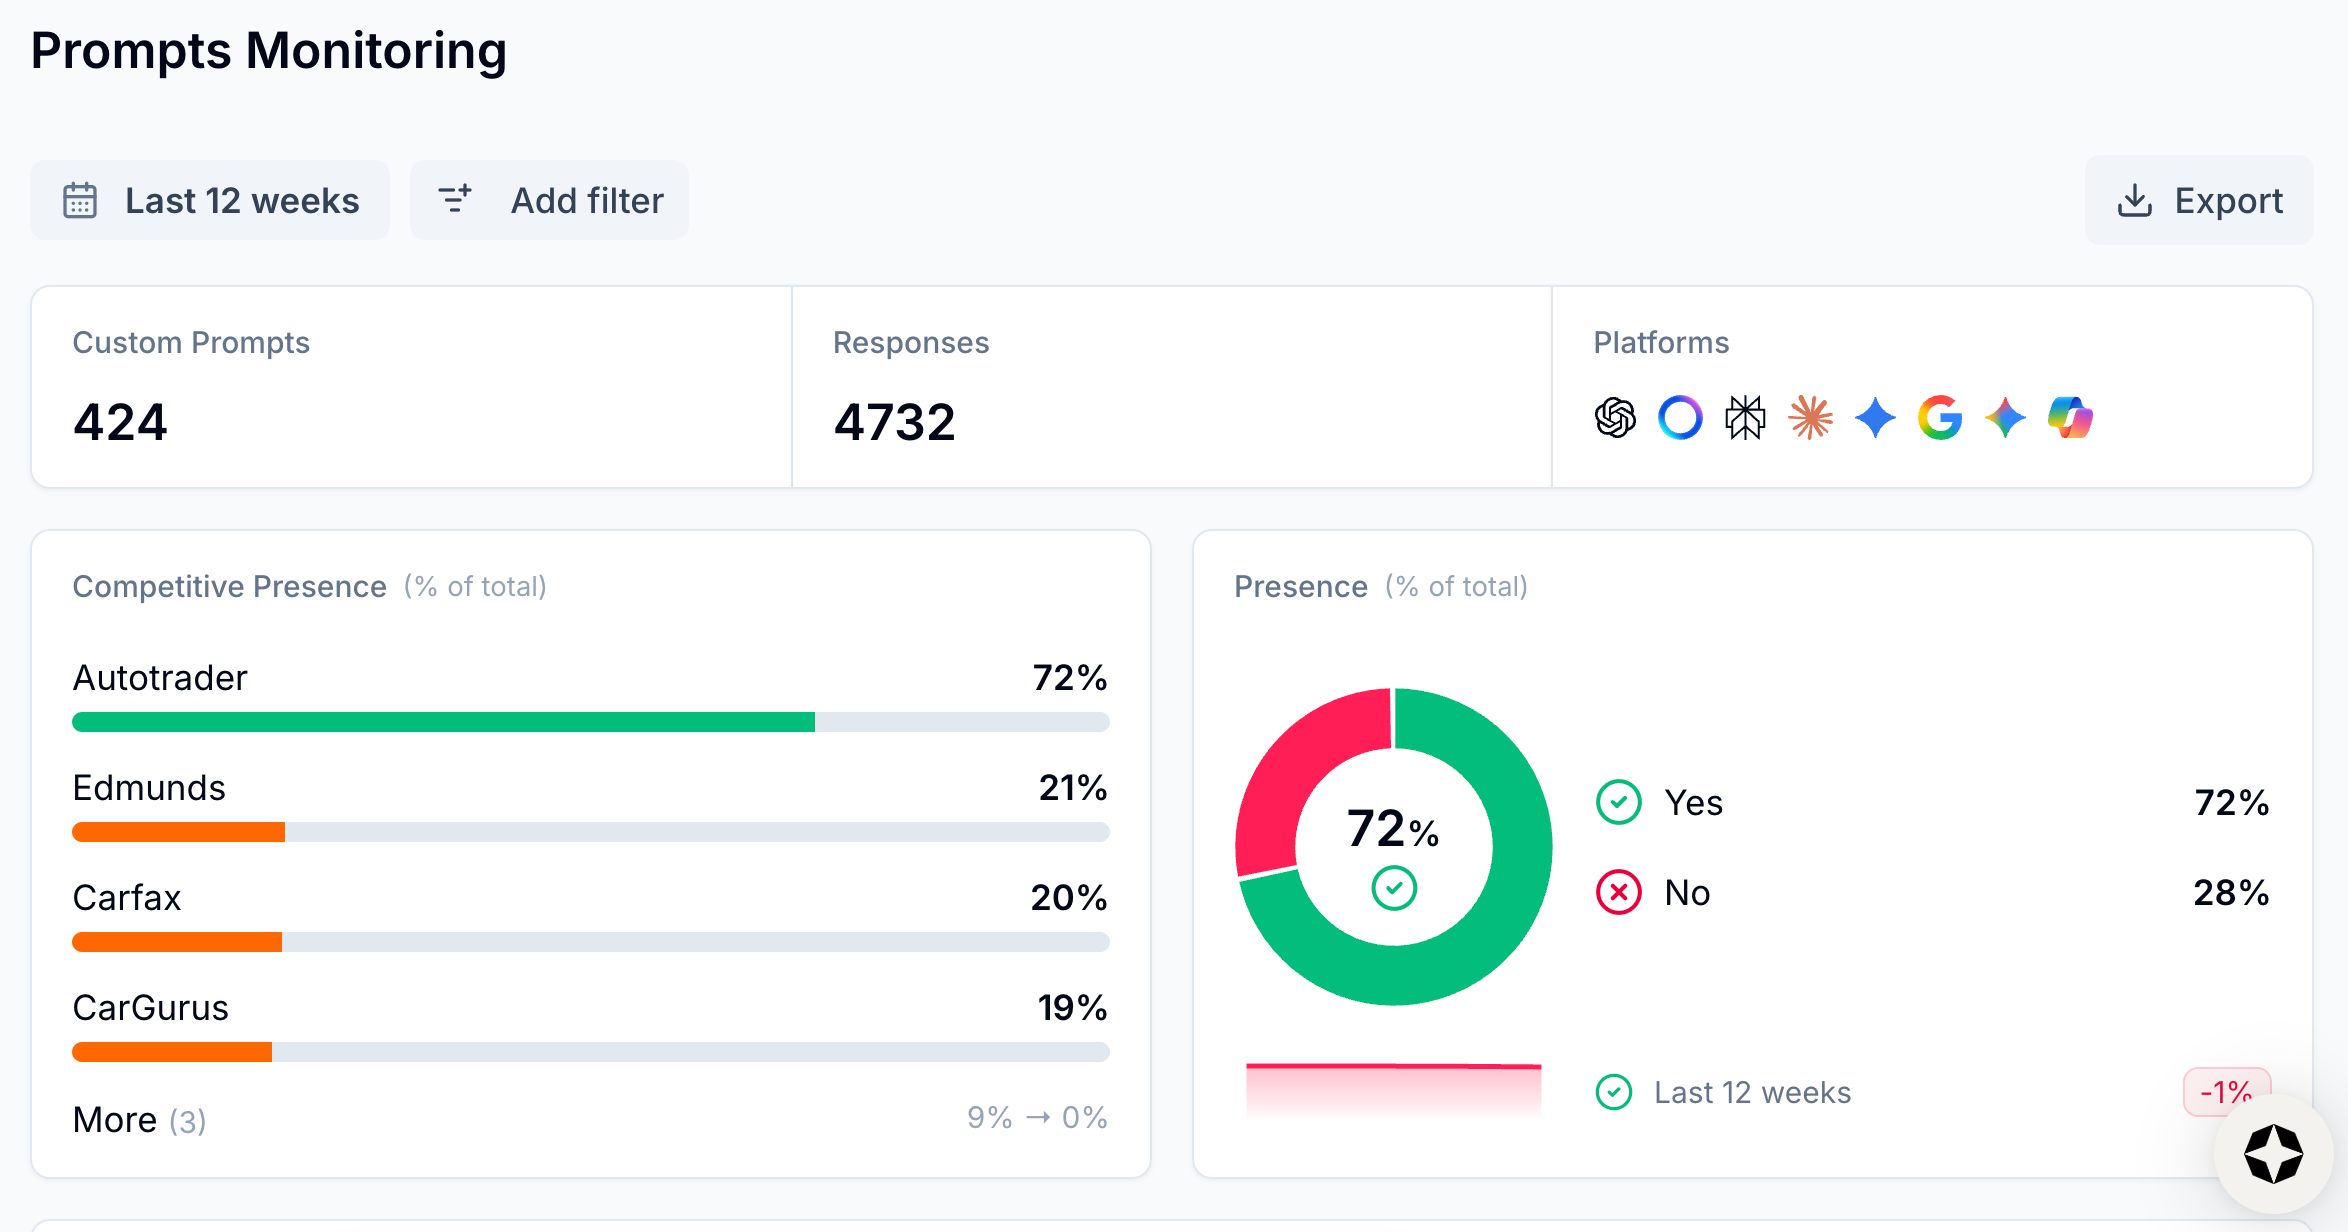
Scrunch is your AI visibility forecast map
Scrunch gives you a consistent way to measure, compare, and improve how your brand is perceived across AI-driven answer surfaces from end to end:
Build and deploy your “weather station” network
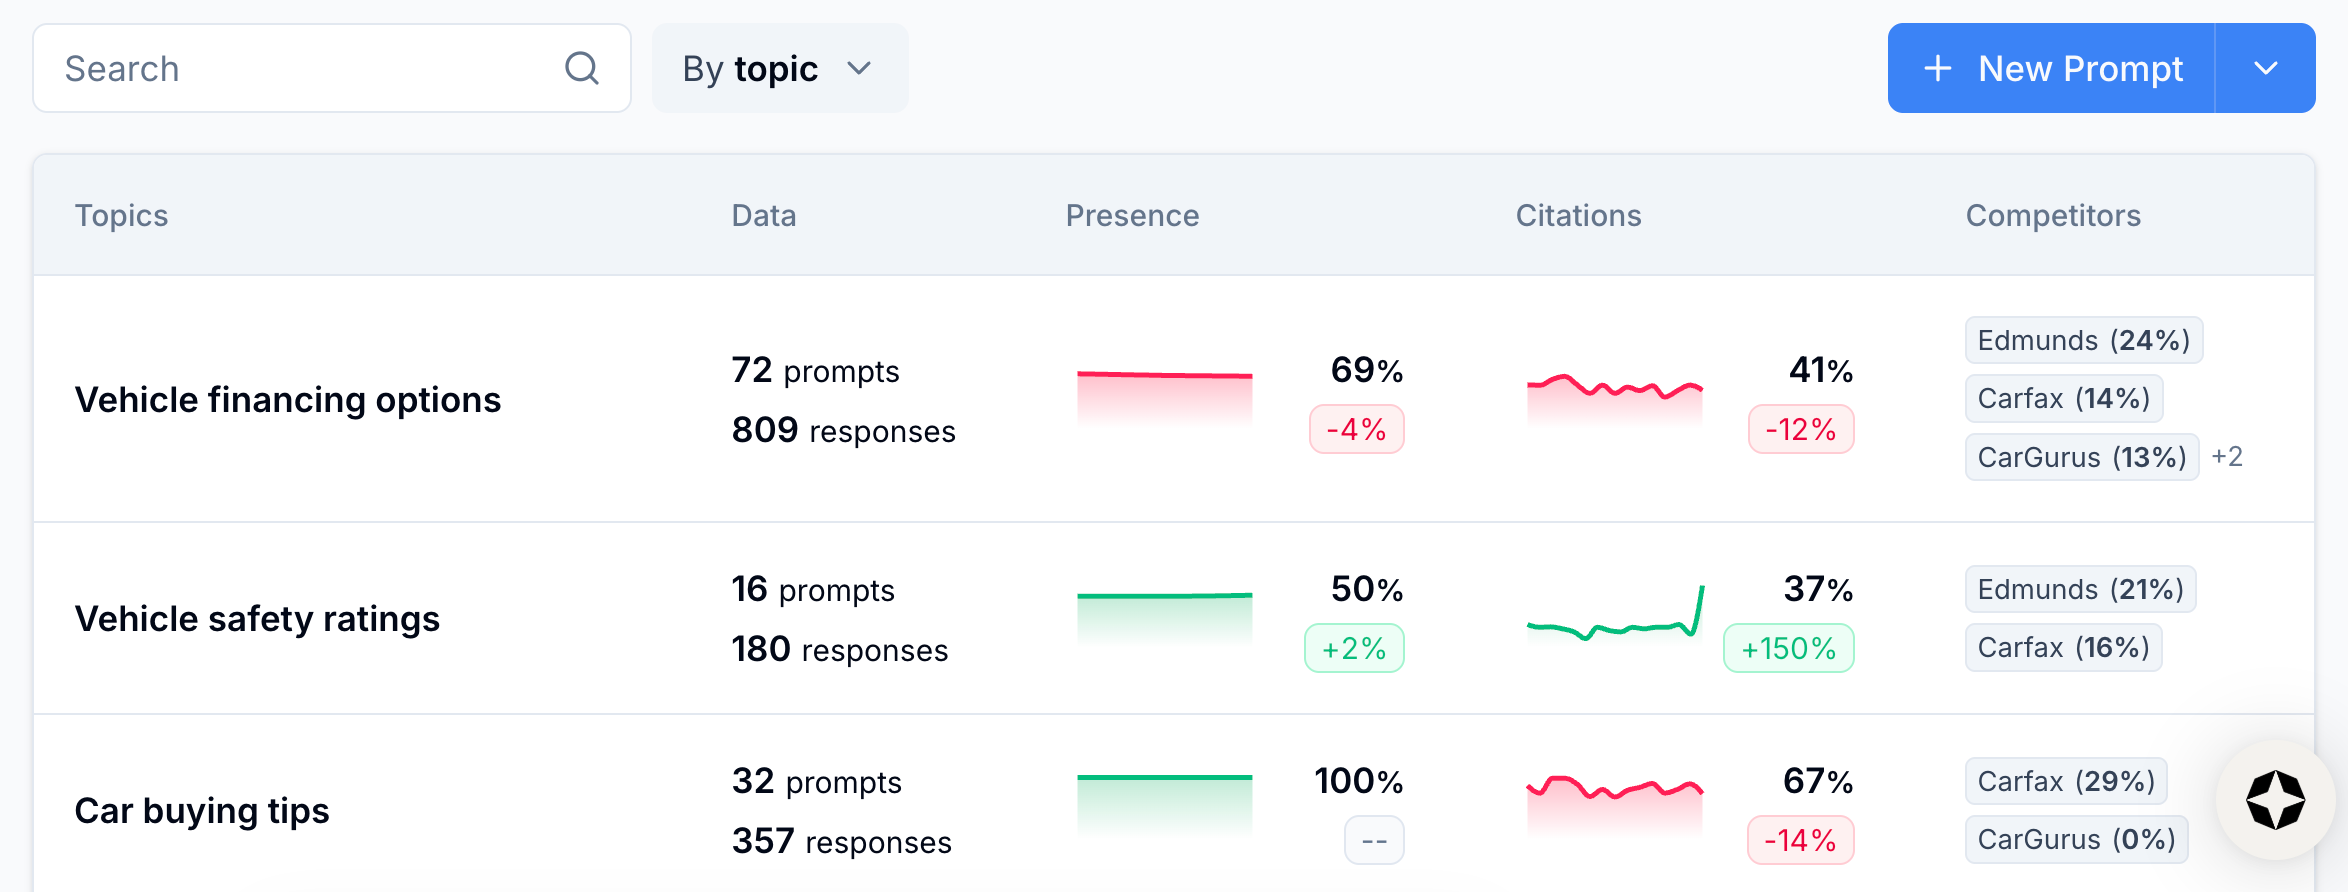
Design and maintain a stable prompt set so readings stay comparable over time. Organize prompts into stable topics that reduce bias, filter noise, and make trends legible.
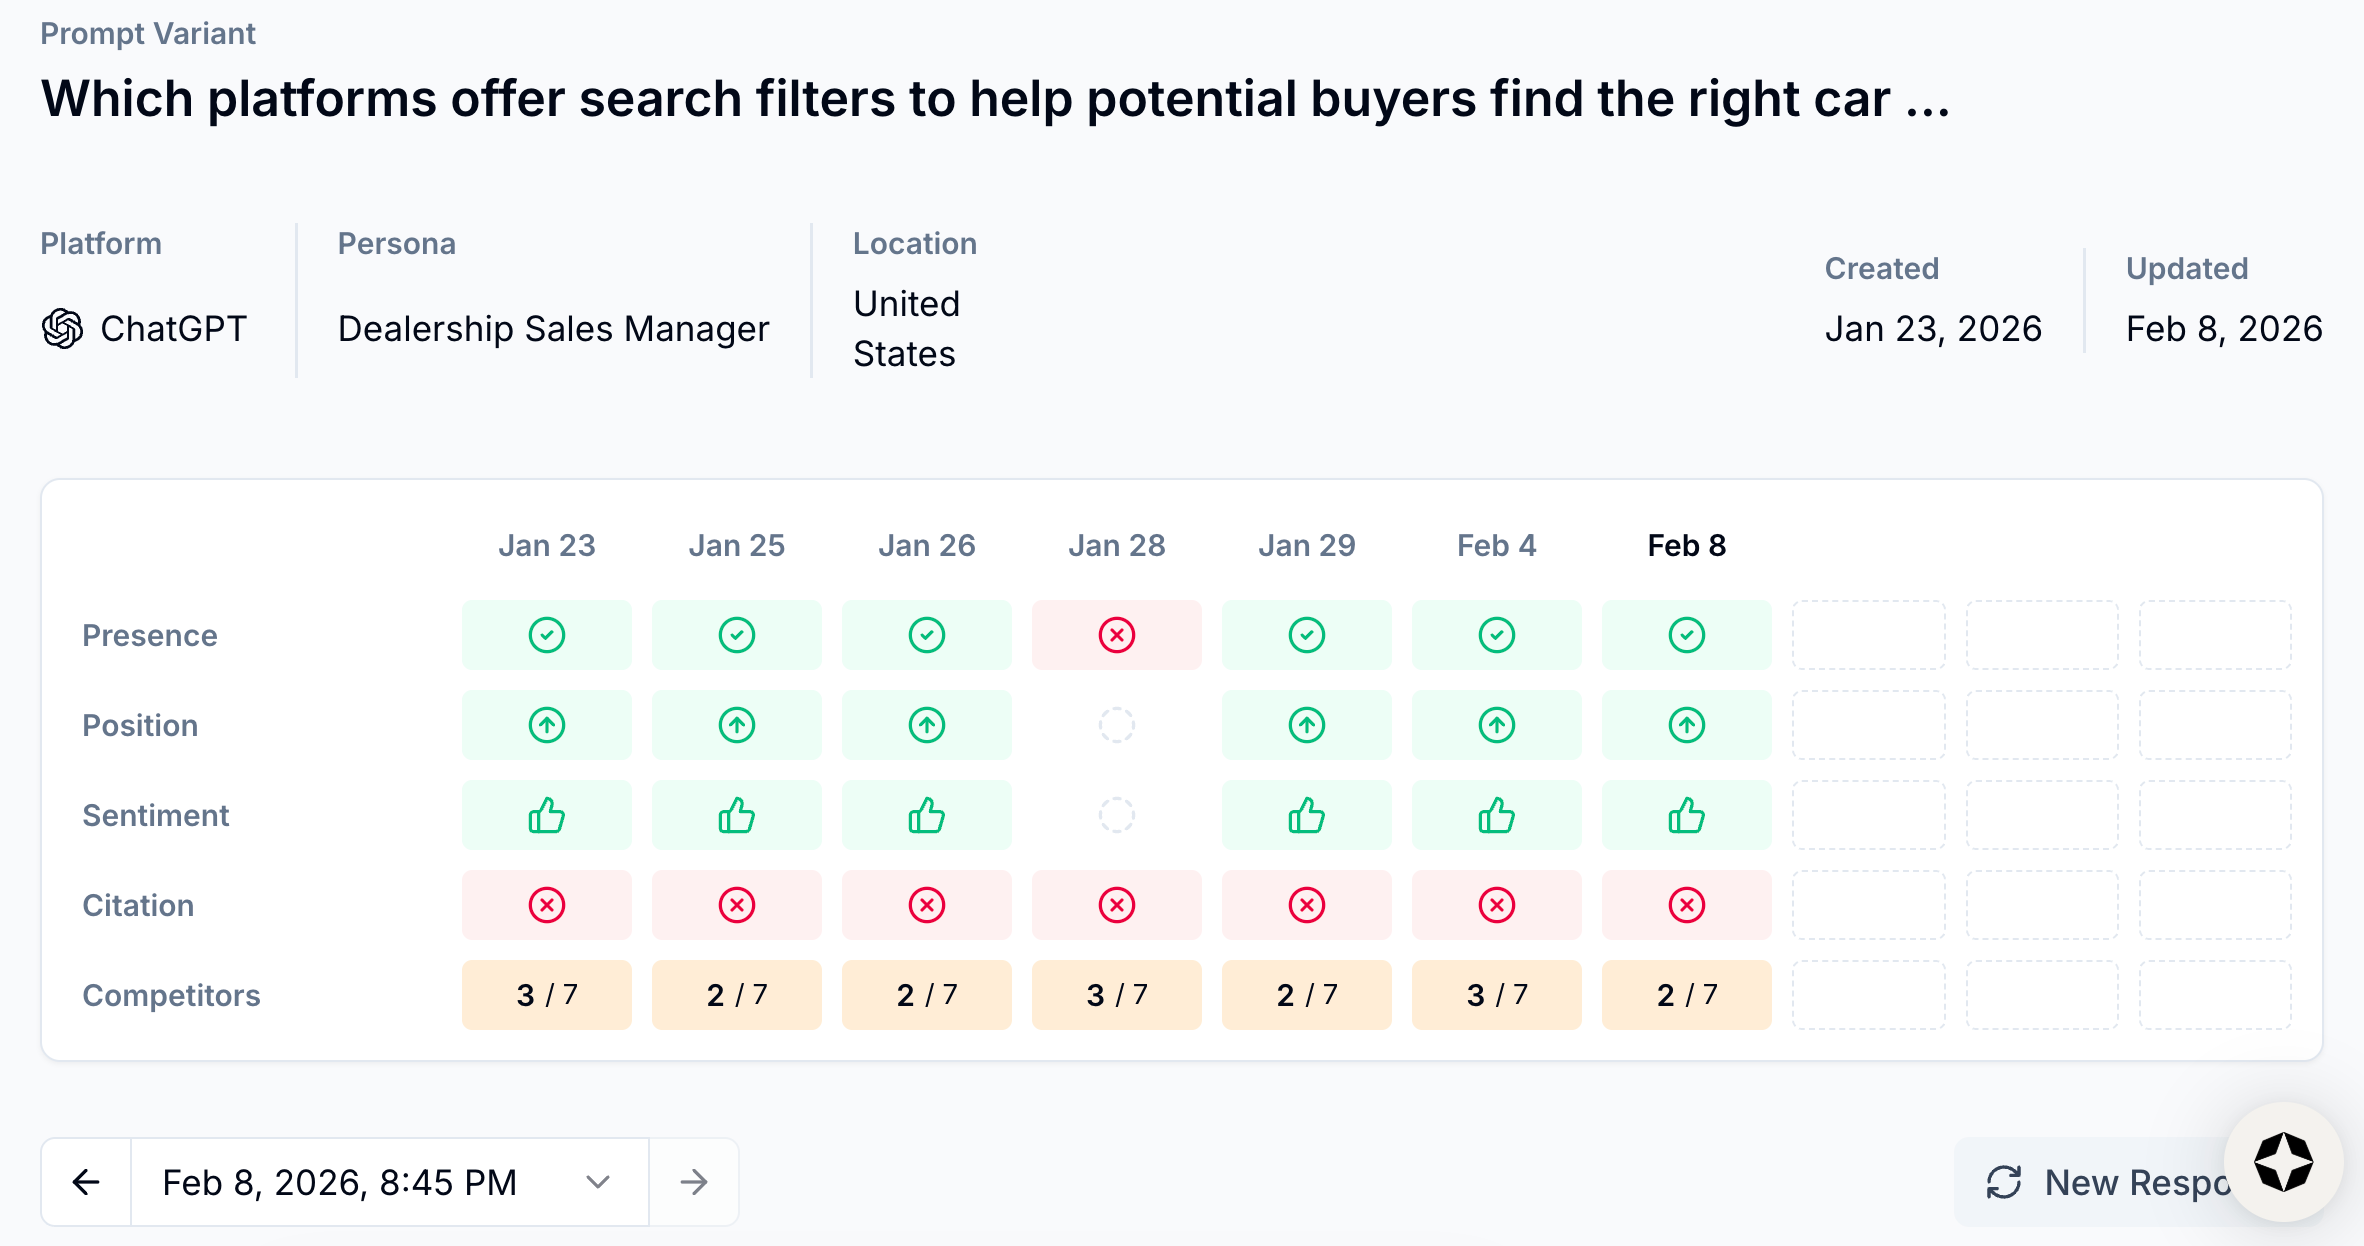
Measure and forecast
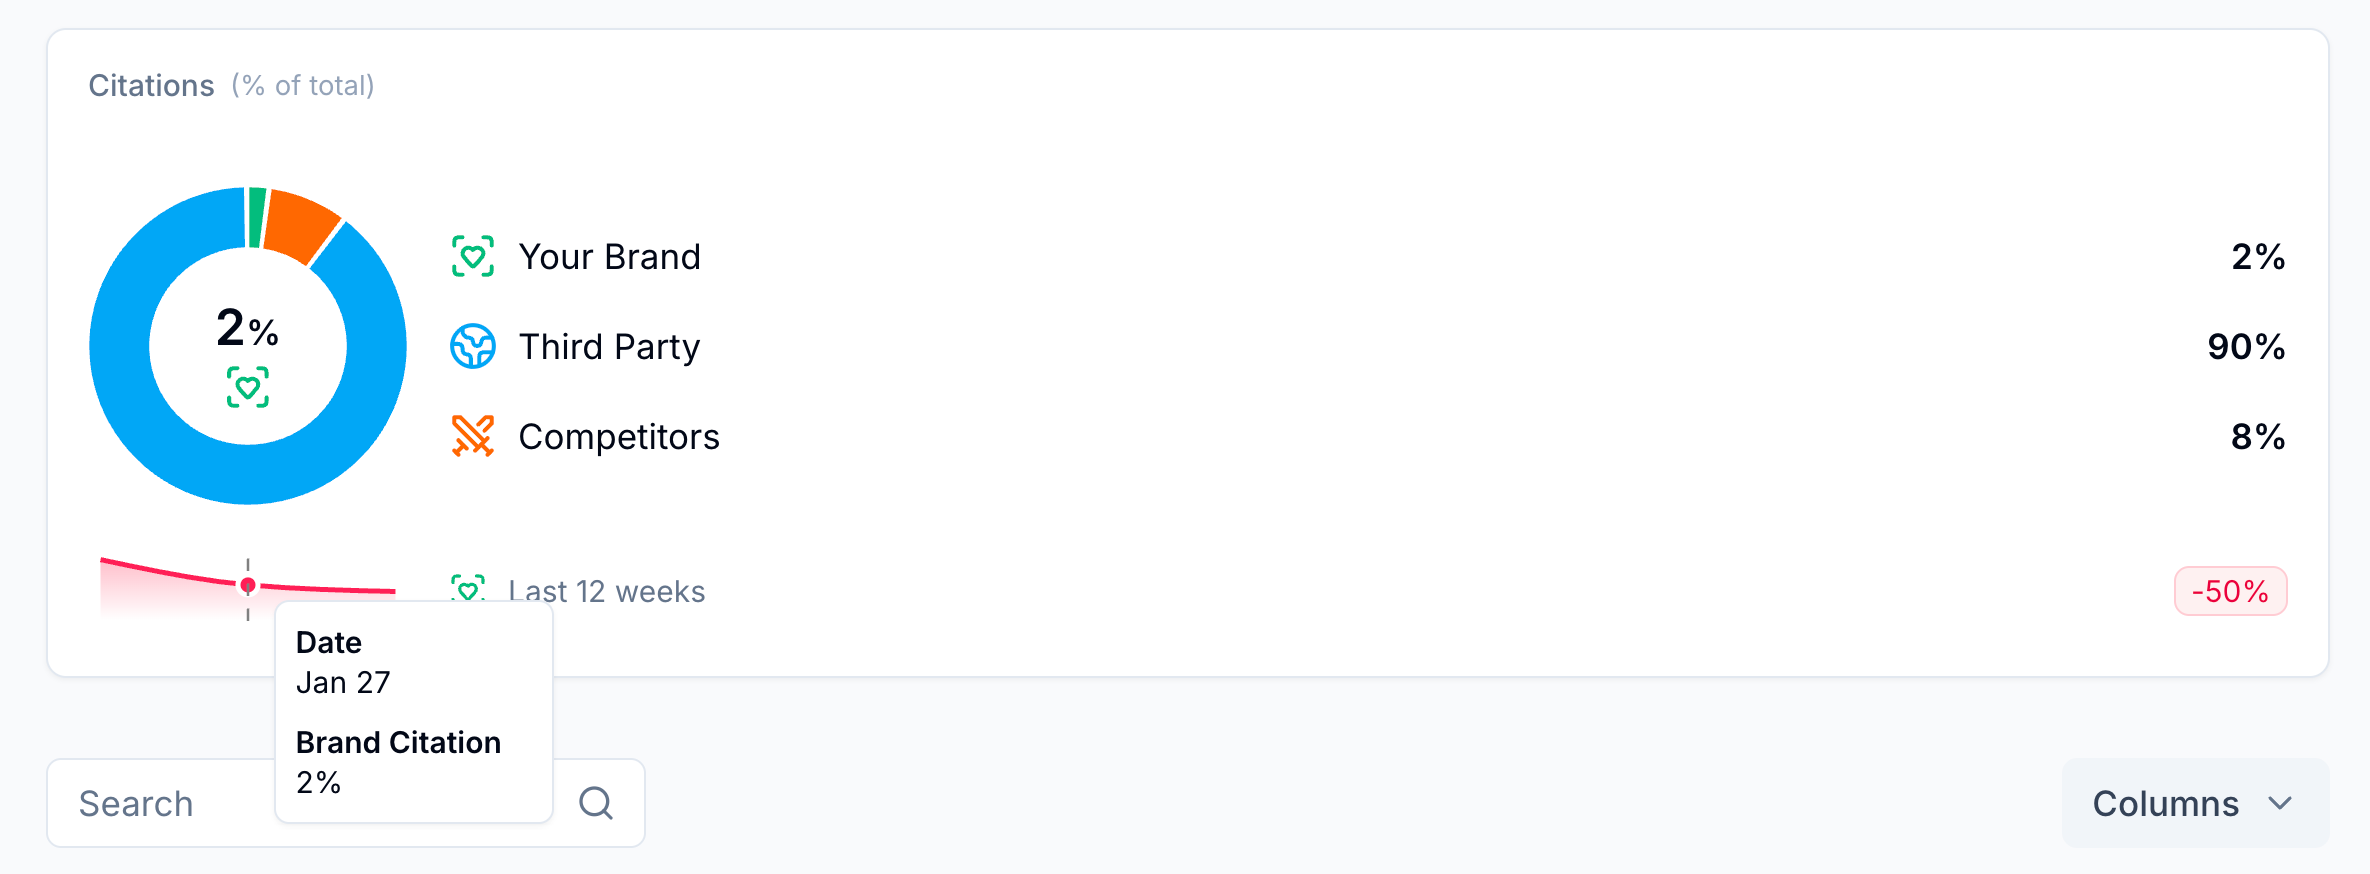
Track visibility, sentiment, prominence, citations, and other perception signals within each topic over time. Benchmark against your baseline and against peers under the same conditions (same prompts, same surfaces, same time frames, etc.) so broad shocks don’t masquerade as wins or losses.
Discover hotspots and anomalies
Bring in real-world signals (panels and census-style sources) to surface emerging and receding topics and competitors. Use spikes to guide investigation and prioritization, not to dictate strategy.
The result? You can confidently answer the questions that really matter to your business:
- Where are we gaining or losing visibility over time?
- Which competitors are moving and on which topics?
- Is this a brand-specific change or did the whole market shift?
- Where are we close enough to overtake competitors with a focused push?
- Which areas are consistently strong so that we know where to defend and expand?
Because the goal isn’t 100% perfect measurement of every prompt—it’s a reliable forecast.
Scrunch helps you see the barometer drop before the weather changes.
Stay ahead of AI search shifts with Scrunch
Separate signal from noise. Start a 7-day free trial or get in touch to see how you can track and action on real AI search activity.