


TLDR:
- Keyword Volume Estimator shows you how many times per week US users ask AI assistants about your keywords—plus why they're asking and what they want to know.
- See weekly volume, demand score, commercial intent score, topic themes, and a 20-week trend for any keyword.
- Numbers are a calibrated estimate from real consumer AI conversations, built to match how people actually talk to AI—not basic keyword matching.
- Keyword Volume Estimator is now available in beta to all Scrunch customers on all plan levels. Reach out to your CSM or contact the Scrunch team to get access.
We’re not the first vendor in the AI search space to introduce keyword-level volume data. There's a reason for that.
Put simply: A wildly misleading number is worse than no number at all.
Marketers are now making real budget bets on AI search. A volume figure that’s off by an order of magnitude can send those bets in the wrong direction.
Naive keyword matching is easy to build. It’s even easier to inflate. So we took our time.
The result is our new Keyword Volume Estimator feature.
It approximates how many times per week people in the US ask AI assistants about a given keyword—along with why they’re asking and what they want to know.
Here’s what it tells you—and, just as importantly—how it tells you.
The story hiding in your keywords
First, let's talk about what Keyword Volume Estimator gives you.
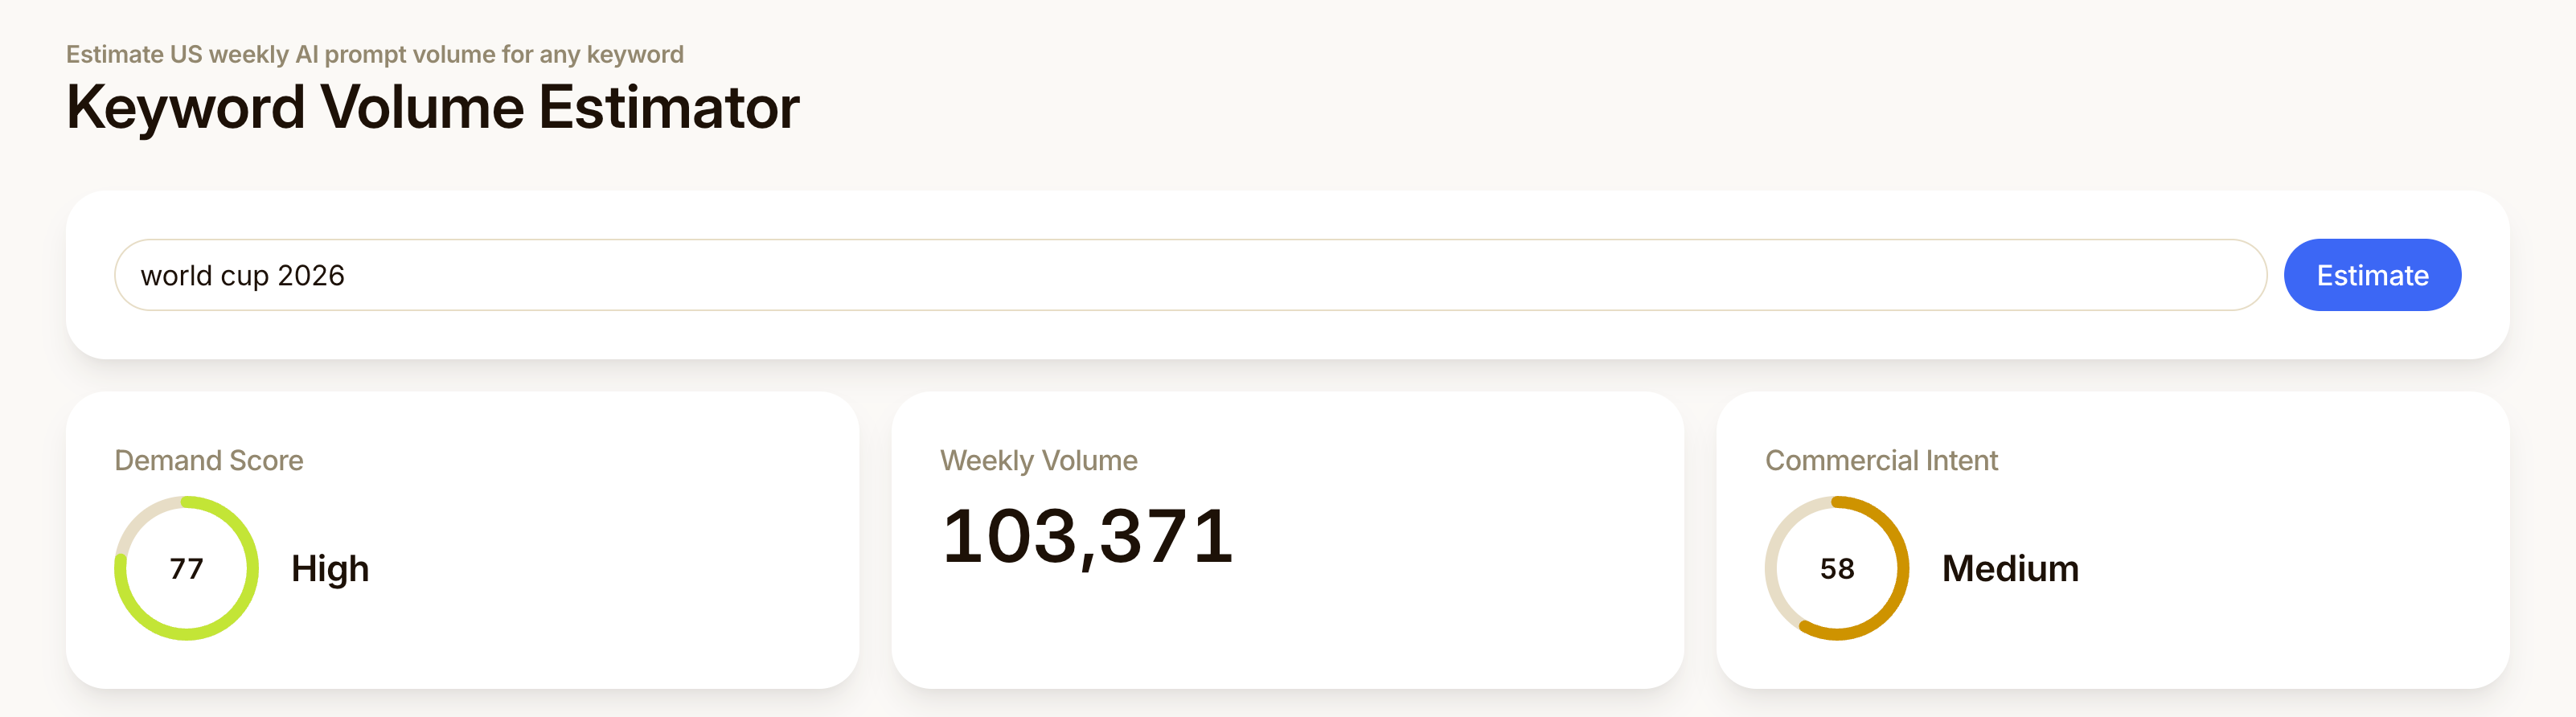
Type in a keyword and it’ll show you:
| Output | What it tells you |
|---|---|
| Weekly volume | An estimate of how many times per week US users prompt AI about your keyword |
| Demand score (0-100) | A score for how much demand a keyword commands |
| Commercial intent score (0-100) | A score for whether people asking about the keyword lean more toward purchase decision or education (the higher the number, the more prompts related to the keyword signal purchase intent) |
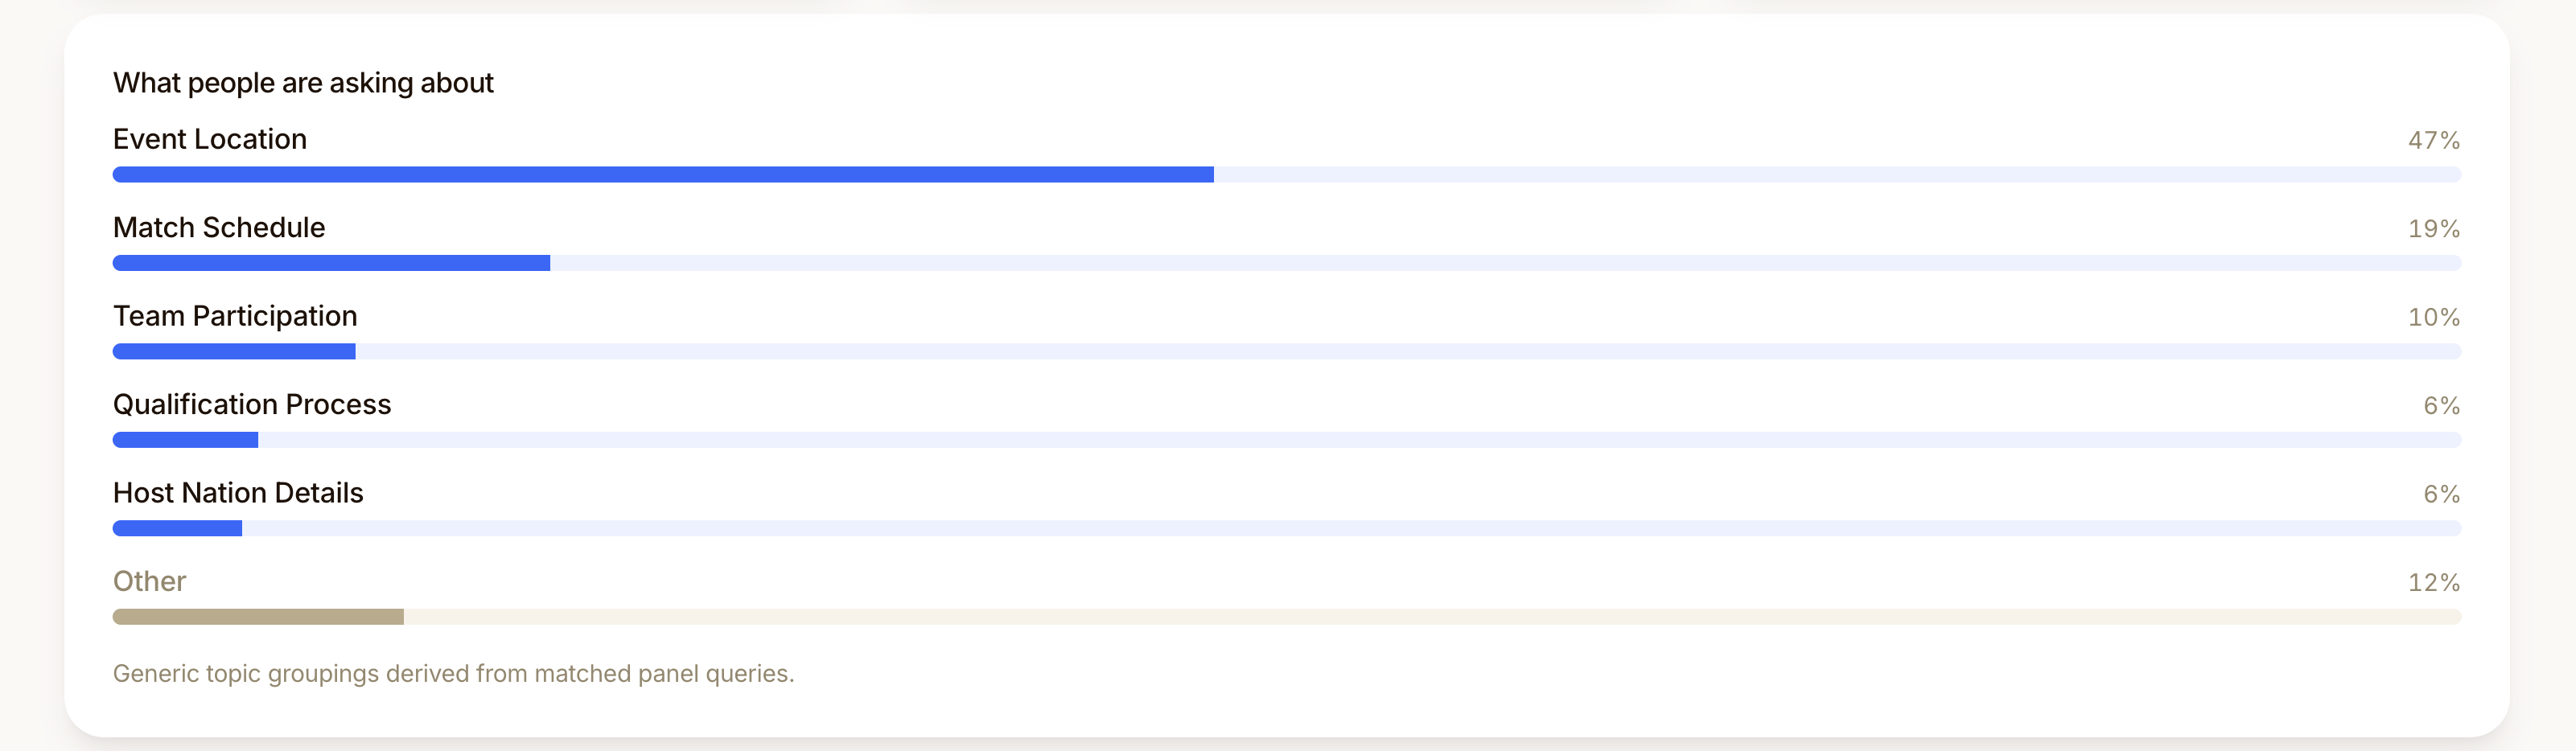
| Topic themes | What people are asking about the keyword, summarized as themes |
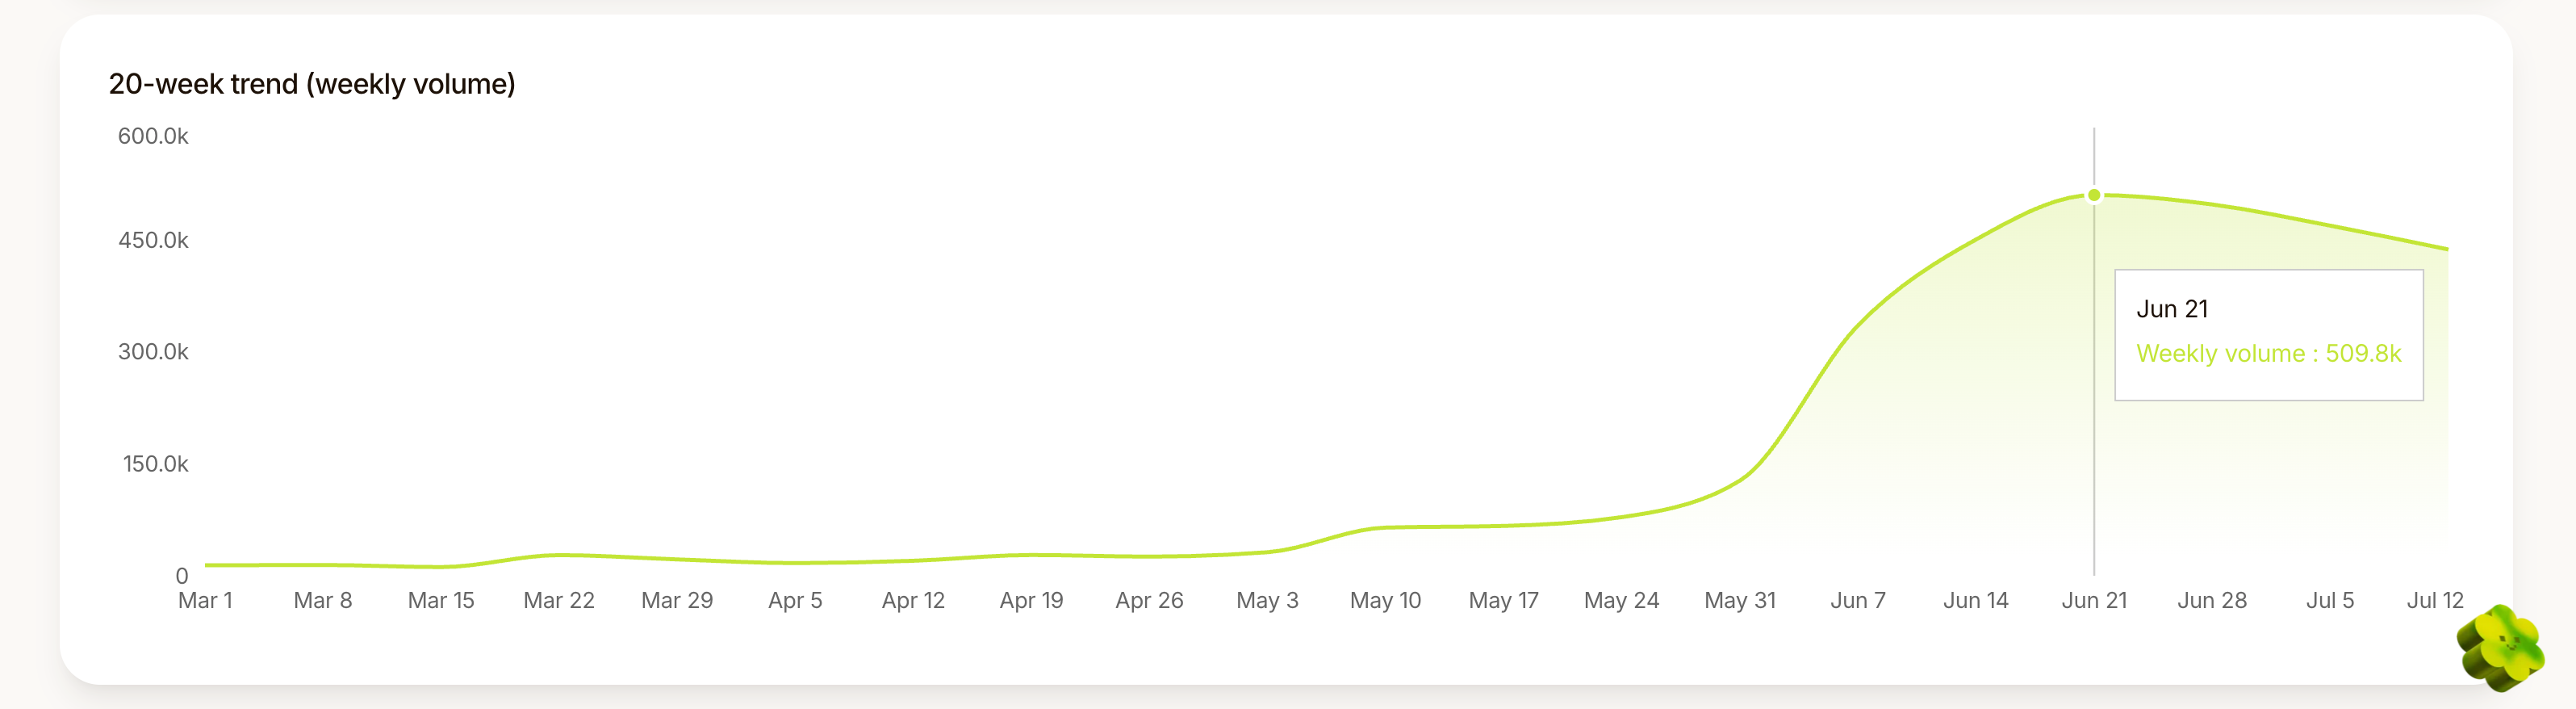
| 20-week trend | Whether interest in the keyword is rising, falling, or staying flat over time |
The math behind the numbers
That’s what you get. Now let’s talk about how you get it.
Our Keyword Volume Estimator approximates volume from a large panel of real consumer AI conversations, then scales that signal up to the US population.
This occurs over the course of seven stages:
Stage 1: Finding prompts that match
We pull panel prompts related to your keyword by looking for meaning, not just wording. Searches like “noise-cancelling headphones” and “best headphones for a long flight” have different wordings but similar meanings, so we count them together.
How we do it
Scrunch runs two retrievers side by side—an exact-wording search and a meaning-based (semantic) search over prompt embeddings. Their union forms the candidate pool.
Stage 2: Making sure prompts are on topic
We only keep results that are genuinely on topic. Meaning-based search casts a wide net, so a second, more careful model re-evaluates each candidate and decides whether it's truly related to the keyword. The share it keeps tells us how on topic the broader pool is.
How we do it
Scrunch uses a cross-encoder reranker to score each candidate against the keyword. The acceptance rate from the judged sample is extrapolated across the full pool.
Stage 3: Scaling prompt data
We scale from the panel to the whole country. Our panel is a sample, not everyone, so we work in proportions. We measure what fraction of all panel activity your keyword represents, then apply that fraction to an estimate of total US AI prompts per week.
How we do it
Our country-wide anchor (~1.6 billion US AI prompts per week and counting) is built bottom-up from published figures on AI adoption, usage per person, and assistant market share, then rederived as those numbers move.
Stage 4: Describing commercial intent
We turn our raw weekly number into a commercial intent score (0-100). We gauge whether the questions skew commercial or informational relative to a typical topic, and we group the matched prompts into a few clear themes described in plain labels.
How we do it
Intent blends the keyword's own signal with the overall baseline, leaning on the baseline when data is thin, so it reads as "above or below normal," not a raw percentage.
Stage 5: Handling the long tail
Brand new or very niche keywords may have too little panel signal to measure directly. For those, we fall back to related external demand signals and how closely the keyword resembles topics we already understand. If a keyword resembles nothing real, we say so rather than invent a number.
How we do it
A fallback cascade anchors sparse terms to external search-volume signal and to similarity against known topic centroids.
Stage 6: Grouping what people ask about
A keyword can hide several distinct questions, so we cluster the on-topic prompts into topic themes and show each theme's share—with anything that doesn't fit pooled honestly into an "Other" bucket.
How we do it
Matched prompts are clustered by similarity and each cluster gets a short label. Themes appear when there are enough real panel matches for meaningfully large clusters.
Stage 7: Tracing demand over time
Our 20-week trend reruns the same logic week by week and smooths it into a clean line, so you can see whether searches are climbing, cooling off, or staying flat.
How we do it
Each point is an exponentially-decayed rolling average over both the matched count and the panel total, keeping the ratio honest as the panel grows; long-tail keywords show no trend rather than a misleading one.
What our analysis is (and isn’t)
All the details above are deliberate. We believe an estimate is only as good as the methodology behind it.
Are we saying our numbers are 100% accurate? No, they’re a calibrated estimate, not a census. You should use them as a reliable order-of-magnitude signal and for comparing topics—not as exact counts.
Also keep in mind that commercial intent is relative. We tell you whether a topic is more or less commercial than average, drawn from the share of prompts we've been able to classify. It’s not a literal "X% commercial” designation.
And remember that estimates and trends only cover US prompts, only at a weekly grain, and only from when the panel history started (i.e., from mid-2025 onward). They also exclude Google AI Overviews (AIOs stem from Google search, which exhibits differing behavior from prompts in AI assistants).
All that being said, this is a feature our customers have been asking for. We felt it was worth doing right. And we’re very pleased with the result.
Still, we invite you to interrogate the data. Ours and every other vendor’s in this space.
Ask how prompts are matched. Ask how nonsense keywords are handled. Ask what happens when the system simply doesn’t know the answer.
Keyword Volume Estimator is now available in beta to all Scrunch customers on all plan levels. Reach out to your CSM or contact the Scrunch team to get access.
We offer a 7-day free trial. You can test it out with a keyword you already understand.
We’d rather you put us to the test than just take our word for it.
See how AI search demand measures up with Scrunch
Learn what users are actually asking AI about. Start a 7-day free trial or get in touch to see how Keyword Volume Estimator can help you zero in on the prompts that matter most.


